|
Minimum Wage Falls to 56-Year Low Relative
to the Average Wage
Center on Budget and Policy Priorities September 1, 2005 September 1, 2005 marks an unhappy anniversary for minimum-wage workers. The federal minimum wage has remained at $5.15 an hour since September 1, 1997. So for eight straight years the value of the minimum wage has eroded due to the effects of inflation, and the wage standard has fallen further behind the wages of other workers. The minimum wage now equals only 32 percent of the average wage for private sector, nonsupervisory workers. This is the lowest share since 1949.
Relative to the Average Wage Since the federal minimum wage was first established in 1938, its level has often been set with the level of other workers in mind. This approach reflects the principle that minimum-wage workers should share in economic gains and should not fall too far behind other workers
Purchasing Power Another standard for assessing the value of the minimum wage is to track its buying power; that is, to adjust its value to take into account changes in the cost of living. Since the minimum wage is set at a given level and not adjusted for inflation, each year that Congress fails to raise the wage floor its purchasing power erodes. Thus, the fact that the minimum wage has remained the same for eight years means that its real value has declined considerably over this period.
Other Periods of Declines Were Followed By Significant Increases in the Wage Standard It is worth noting that after the minimum wage fell to an exceptionally low level in 1989, early the next year Congress adopted, with the then-President Bush's support, an increase in the minimum wage of 27 percent over a two-year period. After the minimum wage last equaled less than a third of the average private nonsupervisory wage (in 1949), the minimum wage was increased by 75 percent. This Congress and the Administration have failed to act on the issue. This has been so despite the strong drop in the value of the minimum wage, as well as the unevenness of the current economic recovery. A variety of data, government officials (including Treasury Secretary John Snow),[4] and stories all confirm that those at the bottom of the economic spectrum are not faring well during this recovery and that the gains from the recovery have been concentrated at the top. For instance, a recent front-page story in The Washington Times said "The revival [in income growth] is mainly among top earners who receive stocks, bonuses and other income in addition to wages.'[5] The Times story drew heavily on July congressional testimony by Federal Reserve Chairman Alan Greenspan, during which he also noted the growth in income and wage disparities.[6] By itself, of course, increasing the minimum wage would not fully correct the imbalances in the current recovery. It would, however, help address them by lifting the buying power of the lowest paid workers and closing some of the distance between the earnings of minimum-wage workers and that of the average worker. After eight years, it remains to be seen whether Congress and the Administration will address the long period of real and relative declines in the minimum wage. Note: For further information on the minimum wage, see the Economic Policy Institute publication "Minimum Wage: Facts at a Glance.' The EPI Web site also contains a series of other reports on the minimum wage. End Notes: [1] Jared Bernstein is Director of the Living Standards program at the Economic Policy Institute. Isaac Shapiro is an associate director at the Center on Budget and Policy Priorities. [2] See, for example, David Lee, "Inequality in the United States During the 1980s: Rising Dispersion or Falling Minimum Wage? Quarterly Journal of Economics, 1999, 114(3), 977-1023. [3] We adjust for inflation using the CPI-RS (research series). The "RS' is a historically consistent series used by many analysts, including the US Bureau of the Census, to adjust for price changes. Relative to the more commonly used CPI-U, the CPI-RS grows more slowly, meaning that the real minimum wage deflated by the CPI-U has a higher peak level: $8.88 in 1968 in today's dollars. [4] Jonathan Weisman, "Snow Concedes Economic Surge Is Not Benefiting People Equally,' The Washington Post, August 9, 2003, page A3. [5] Patrice Hill, "Income gap grows in U.S.,' The Washington Times, July 31, 2005, page A1. [6] Alan Greenspan, Chairman of the Federal Reserve Board, Testimony before the House Financial Services Committee, Question and Answer period, July 30, 2005. 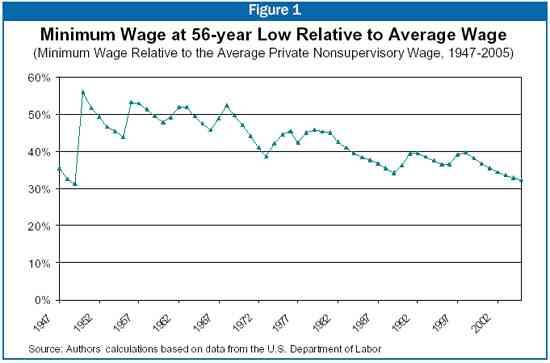 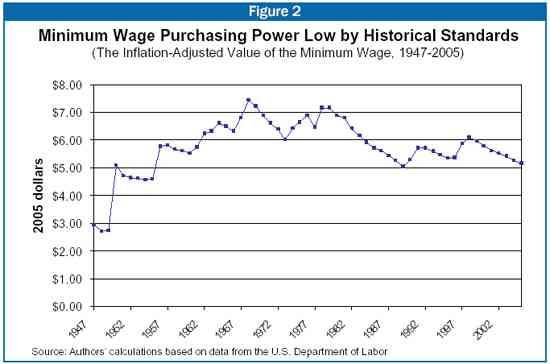
Commentary: |
|
||||||||||||||||||||||||||||||||||||||||||||||||||||||||||||||||||||||||||||||||||||||||||||||||||||||||||||||||||||||||||||||||||||||||||||||||||||||||||||||||||||||||||||||||||||||||||||||||||||||||||||||||||||||||||||||||||||||||||||||||||||||||