Gallup.com
by Lydia Saad
May 15, 2006
GALLUP NEWS SERVICE
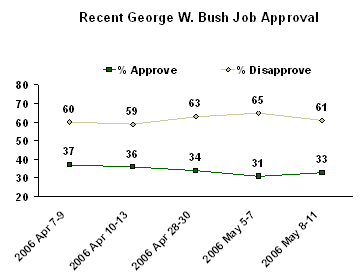
PRINCETON, NJ -- A new Gallup survey finds George W. Bush marking time at an uncomfortable place -- near the all-time low of public approval for his presidency. According to the May 8-11 poll, 33% of Americans currently approve of the job Bush is doing as president, essentially unchanged from the 31% approving in a USA Today/Gallup poll conducted last weekend.

The same survey finds public approval of Congress and general satisfaction with the nation also at the lowest points these have been during the Bush administration. Only 21% of Americans approve of the job Congress is doing, similar to the 23% who said this in April, and coming very close to the all-time record low of 18% recorded in March 1992. The percentage satisfied with the way things are going in the country today is 25%, down from 27% in April, and the lowest recorded since January 1996. The low point on this measure was 12% in 1979.
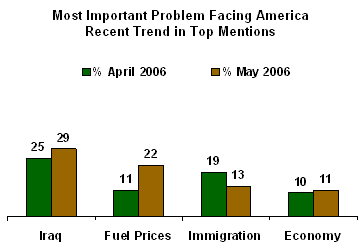
Similar to 1979, a possible explanation for Americans' grim mood today is fuel prices. The percentage naming fuel costs as the nation's top problem has doubled over the past month, from 11% to 22%, and appears to be spilling over into concern about the nation's economy, concerns about which are also elevated.
Most interviews for the new survey were conducted prior to a May 11 USA Today story exposing a classified National Security Agency program in which millions of Americans' phone records are being compiled in a database, reportedly designed to help spot terrorist activity. How this may affect public support for Bush is still unclear.
Bush Short on Support From Republicans
Current public support for the job Bush is doing is down from early to mid-April when his approval rating was in the 36% to 37% range. The 31% approval recorded for Bush earlier this month is his lowest according to Gallup trends, but still above the low Gallup recorded for all presidents, set by Harry Truman in 1952 with 22% approval.
Last week, Gallup reported a notable decline in support for Bush among Republicans. Republicans' approval of Bush was 68% in the May 5-7 survey, down from an average of close to 80% from February to April. This compares with an average of 85% approval from Republicans for all of 2005. With just 70% of Republicans now approving of Bush, the new poll confirms that Bush has indeed lost esteem within his political base.
Bush's approval rating from independents, 23%, remains about where it has been in recent polls, while his 12% approval rating from Democrats is slightly above the single-digit readings recorded in the two previous surveys.
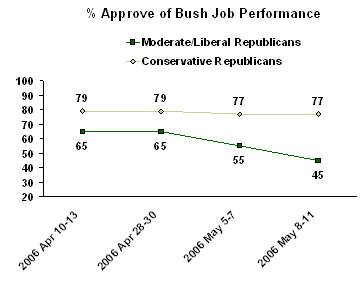
Many have speculated that the administration's policies on immigration and federal spending have angered conservatives, but conservative Republican support for Bush has held steady in the past two months, though it is down from where it was in previous years. At the same time, the percentage of moderate and liberal Republicans who approve of Bush's job performance has dropped 20 percentage points, from 65% to 45%.

Gas Prices Fueling Economic Unease
The percentage of Americans identifying gas or oil prices as being the nation's most important problem has doubled from 11% in April to 22% in the current poll. Now, only the situation in Iraq, mentioned by 29%, exceeds gas or oil prices as the perceived number one problem facing the country. Immigration ranked second in April, but mentions of this issue dropped over the past month from 19% to 13%.
The economy is the only other issue named by at least 10% of Americans, registering 11% in May, compared with 10% in April.

While the economy is not an increasingly top-of-mind concern for Americans, it is viewed less positively now than it has been for the previous several months. When asked to rate current economic conditions, only 29% today call them "excellent" or "good." This is down from 38% in April -- which is also the average positive economic score recorded since December. Consumer spirits on this measure have not registered this low since May 2004.
Americans' outlook for the economy also fell a notch since April. The percentage saying the economy is getting better dropped from 29% to 26%, while those saying it is getting worse grew from 64% to 68%. This is the most pessimistic Gallup has found Americans to be all year, but is similar to where this measure stood last September and October.
Survey Methods
These results are based on telephone interviews with a randomly selected national sample of 1,002 adults, aged 18 and older, conducted May 8-11, 2006. For results based on this sample, one can say with 95% confidence that the maximum error attributable to sampling and other random effects is ±3 percentage points. In addition to sampling error, question wording and practical difficulties in conducting surveys can introduce error or bias into the findings of public opinion polls.
2. Do you approve or disapprove of the way Congress is handling its job?
|
Approve |
Dis- |
No |
|
|
2006 |
% |
% |
% |
|
2006 May 8-11 |
21 |
71 |
8 |
|
2006 Apr 10-13 |
23 |
70 |
7 |
|
2006 Mar 13-16 |
27 |
65 |
8 |
|
2006 Feb 6-9 |
25 |
65 |
10 |
|
2006 Jan 9-12 |
27 |
67 |
7 |
3. In general, are you satisfied or dissatisfied with the way things are going in the United States at this time?
|
Satisfied |
Dis- |
No |
|
|
2006 |
% |
% |
% |
|
2006 May 8-11 |
25 |
72 |
3 |
|
2006 Apr 10-13 |
27 |
71 |
2 |
|
2006 Mar 13-16 |
29 |
68 |
2 |
|
2006 Feb 6-9 |
35 |
62 |
3 |
|
2006 Jan 20-22 |
35 |
62 |
3 |
|
2006 Jan 9-12 |
36 |
61 |
3 |
9. How would you rate economic conditions in this country today -- as excellent, good, only fair, or poor?
|
Excell- |
Good |
Only |
Poor |
No |
|
|
2006 |
% |
% |
% |
% |
% |
|
2006 May 8-11 |
4 |
25 |
45 |
25 |
* |
|
2006 Apr 10-13 |
5 |
33 |
40 |
23 |
-- |
|
2006 Mar 13-16 |
4 |
30 |
45 |
20 |
1 |
|
2006 Feb 6-9 |
4 |
34 |
42 |
20 |
* |
|
2006 Jan 20-22 |
5 |
34 |
41 |
18 |
1 |
|
2006 Jan 9-12 |
8 |
35 |
37 |
18 |
1 |
|
* = Less than 0.5% |
|||||
10. Right now, do you think that economic conditions in the country as a whole are getting better or getting worse?
|
Getting |
Getting |
SAME |
No |
|
|
2006 |
% |
% |
% |
% |
|
2006 May 8-11 |
26 |
68 |
4 |
2 |
|
2006 Apr 10-13 |
29 |
64 |
5 |
2 |
|
2006 Mar 13-16 |
29 |
61 |
8 |
2 |
|
2006 Feb 6-9 |
34 |
57 |
7 |
3 |
|
2006 Jan 20-22 |
35 |
54 |
7 |
3 |
|
2006 Jan 9-12 |
39 |
52 |
7 |
2 |
|
vol. = Volunteered response |
||||
ECONOMIC OUTLOOK GROUPS (COMBINED RESPONSES: Q.9-10)
|
Positive |
Mixed |
Negative |
Undesig- |
|
|
2006 |
% |
% |
% |
% |
|
2006 May 8-11 |
19 |
18 |
61 |
2 |
|
2006 Apr 10-13 |
25 |
19 |
55 |
2 |
|
2006 Mar 13-16 |
24 |
18 |
55 |
2 |
|
2006 Feb 6-9 |
26 |
22 |
50 |
3 |
|
2006 Jan 20-22 |
30 |
17 |
49 |
4 |
|
2006 Jan 9-12 |
31 |
22 |
44 |
2 |
Commentary:
The best part of this poll is it proves once and for all that you can't spend
enough to satisfy a fiscal conservative in the republican party. One would
think record deficits are important to this group - not true. Conservatives
don't care about our future, they only care about power.