Gallup
by Lydia Saad
March 22, 2006
GALLUP NEWS SERVICE
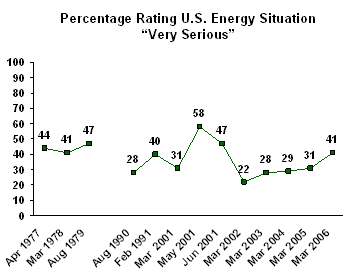
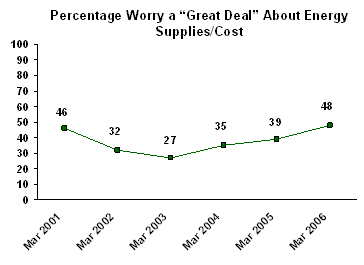
PRINCETON, NJ -- Public concern about the United States' energy supply is up sharply this year. According to Gallup's annual Environment survey, updated March 13-16, there has been a 10-point increase (from 31% to 41%) in the percentage of Americans rating the nation's energy situation as "very serious," and a 9-point increase (from 39% to 48%) in the percentage worrying "a great deal" about the nation's energy supply.
President George W. Bush earns poor marks for his handling of energy policy. Only 25% of Americans, down from 32% last year, say he is doing a good job of improving the nation's energy policy. Sixty-three percent say he is doing a poor job. Similarly, a March 10-12 CNN/USA Today/Gallup poll found only 24% of Americans believe Bush is doing enough to solve the nation's energy problems. This is down from 38% in 2001.
Along with increased concern about the energy situation, the Environment survey records a slight shift in Americans' preferences for how the nation's energy problem should be addressed. When asked which of two approaches they prefer the United States to follow -- more production of oil, gas, and coal supplies, or more conservation of existing supplies by consumers -- Americans choose conservation over production, 55% to 35%. However, the percentage favoring more production is up seven points from the 28% recorded last year, while the percentage favoring conservation has declined six points.
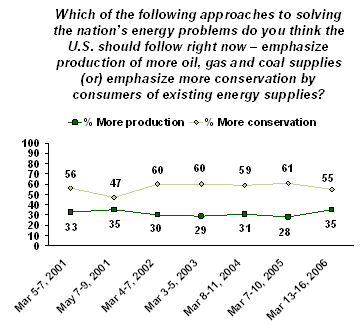
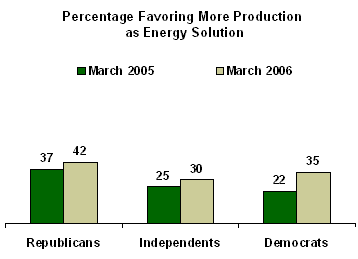
Republicans are about evenly divided between favoring more production versus more conservation; majorities of independents and Democrats prefer conservation. Among all three groups, support for more energy production has increased over the past year.
Energy Concerns Rise
Today, 41% of Americans say the energy situation in the United States is very serious, up from 31% recorded last March. This is lower than the 58% recorded in 2001 during the height of the West Coast energy shortage, and the 47% recorded during the 1979 energy crisis, but is similar to the 40% found during the 1991 Gulf War.
The "availability and affordability" of energy is now of great concern to nearly half of Americans (48%). Another 35% say they worry "a fair amount" about it, while just 17% worry "only a little" or "not at all." This is the highest degree of concern on this measure Gallup has recorded since March 2001, and represents a significant increase from last year when only 39% were greatly concerned.
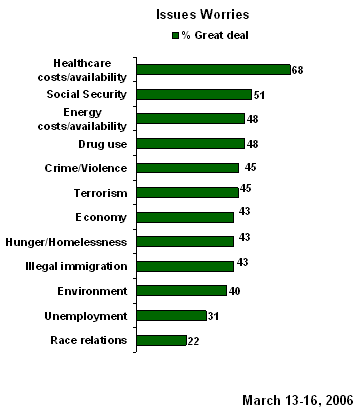
Energy ranks fairly high as a concern on the list of domestic issues rated in the latest survey. Only healthcare is rated significantly higher. Energy is closely matched with Social Security, crime, and the possibility of future terrorist attacks as a public concern. Unemployment and race relations are of less concern.
Future Energy Shock?
Americans today are especially mindful of energy as a long-term problem. When asked what the most important problem facing the United States will be in 25 years, 10% of Americans, up from 5% last year, name energy. As a result, energy now ties with Social Security as the No. 1 perceived long-term problem for the country.
By contrast, only 2% of Americans cite energy as the most important problem facing the country currently. Today's low level of top-of-mind concern about energy is typical of recent years; however it was substantially higher (reaching 12%) for a short period in 2001 because of the energy shortage in California that resulted in temporary power blackouts.
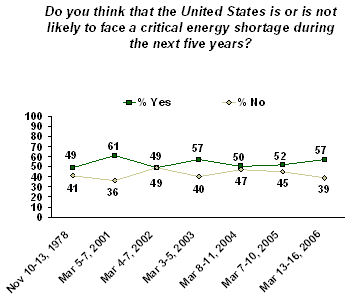
The percentage of Americans saying the United States will face a critical energy shortage in the next five years has fluctuated since 2001 in response to domestic and international events. During the West Coast energy shortage in 2001, 61% of Americans said a critical energy shortage was possible. This dropped to 49% the following year, but spiked again just prior to the start of the 2003 Iraq war. At 57%, the current percentage saying this is slightly higher than the 52% recorded last year.
Bush's Energy Rating Slides
Bush's positive ratings on the energy issue have declined over the past year. Only 25% of Americans think Bush is doing a good job of improving the nation's energy policy, down from 32% in 2005.
Whether this recent drop reflects increased public criticism of Bush's energy policy, or is a result of the broader decline in Bush's job approval ratings over the past year, is not clear. Today Bush's overall job approval rating is 37%, down substantially from the 52% recorded in last year's Environment survey.
Bush's rating on energy policy has steadily declined since the start of his term. Since 2003, a plurality or majority of Americans have said he is doing a poor job of improving the nation's energy policy. By contrast, in 2002, a plurality of Americans felt he was doing a good job. And in 2001, at the start of his term, a solid majority expected that he would do a good job.
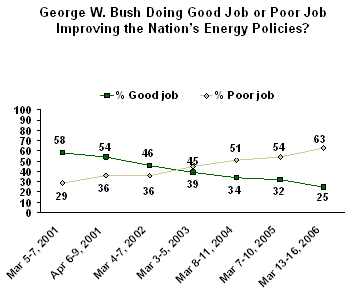
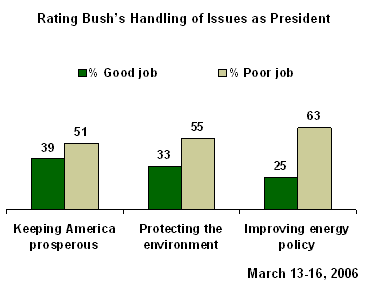
Bush's current ratings for his handling of energy policy are worse than those he receives for either the environment or the economy.
Another indicator of Americans' discontent with current energy policy comes from Gallup's January Mood of the Nation poll. The Jan. 9-12 survey showed a 10-point decline over the past year, from 39% to 29%, in public satisfaction with the nation's energy policies. This is the lowest Gallup satisfaction score recorded on this measure since it was initiated in 2001.
|
Satisfaction With the Nation's Energy Policies |
|||
|
|
Total |
Total |
Net |
|
|
% |
% |
|
|
2006 Jan 9-12 |
29 |
55 |
-26 |
|
2005 Jan 3-5 |
39 |
45 |
-6 |
|
2004 Jan 12-15 |
46 |
41 |
5 |
|
2003 Jan 13-16 |
40 |
43 |
-3 |
|
2002 Jan 7-9 |
45 |
42 |
3 |
|
2001 Jan 10-14 |
32 |
49 |
-17 |
Survey Methods
The latest results are based on telephone interviews with a randomly selected national sample of 1,000 adults, aged 18 and older, conducted March 13-16, 2006. For results based on this sample, one can say with 95% confidence that the maximum error attributable to sampling and other random effects is ±3 percentage points. In addition to sampling error, question wording and practical difficulties in conducting surveys can introduce error or bias into the findings of public opinion polls.
36. Overall, do you think President Bush is or is not doing enough to solve the country's energy problems?
BASED ON 483 NATIONAL ADULTS IN FORM B
|
Doing |
Not |
DOING TOO |
No |
|
|
|
|
|
|
|
|
2006 Mar 10-12 ^ |
24% |
71 |
* |
5 |
|
|
|
|
|
|
|
2001 May 18-20 |
38% |
55 |
1 |
6 |
|
|
|
|
|
|
|
^Asked of a half sample |
||||
|
(vol.) = Volunteered response |
||||
|
*Less than .5% |
||||
12. Next I'm going to read a list of problems facing the country. For each one, please tell me if you personally worry about this problem a great deal, a fair amount, only a little, or not at all? First, how much do you personally worry about -- [ITEMS A-J READ IN RANDOM ORDER, ITEM L READ LAST]?
|
|
|
|
Only a little/ |
|
% |
% |
% |
|
|
The availability and affordability of healthcare |
68 |
21 |
11 |
|
The Social Security system |
51 |
29 |
20 |
|
The availability and affordability of energy |
48 |
35 |
17 |
|
Drug use |
48 |
25 |
27 |
|
Crime and violence |
45 |
36 |
19 |
|
The possibility of future terrorist attacks in the U.S. |
45 |
31 |
24 |
|
The economy |
43 |
37 |
19 |
|
Hunger and homelessness |
43 |
34 |
23 |
|
Illegal immigration |
43 |
29 |
28 |
|
The quality of the environment |
40 |
37 |
23 |
|
Unemployment |
31 |
34 |
35 |
|
Race relations |
22 |
36 |
42 |
13. Do you think George W. Bush is doing a good job or a poor job in handling each of the following issues as president? How about -- [RANDOM ORDER]?
A. Protecting the nation's environment
|
|
|
FAIR/ |
|
|
|
% |
% |
% |
% |
|
|
2006 Mar 13-16 |
33 |
55 |
9 |
3 |
|
|
|
|
|
|
|
2005 Mar 7-10 |
39 |
50 |
8 |
3 |
|
2004 Mar 8-11 |
41 |
46 |
9 |
4 |
|
2003 Mar 3-5 |
44 |
43 |
7 |
6 |
|
2002 Mar 4-7 |
50 |
38 |
7 |
5 |
|
2001 Apr 6-9 ^ |
49 |
41 |
4 |
6 |
|
2001 Mar 5-7 ^ |
51 |
38 |
5 |
6 |
B. Improving the nation's energy policy
|
|
|
FAIR/ |
|
|
|
% |
% |
% |
% |
|
|
2006 Mar 13-16 |
25 |
63 |
7 |
5 |
|
|
|
|
|
|
|
2005 Mar 7-10 |
32 |
54 |
7 |
7 |
|
2004 Mar 8-11 |
34 |
51 |
8 |
7 |
|
2003 Mar 3-5 |
39 |
45 |
7 |
9 |
|
2002 Mar 4-7 |
46 |
36 |
8 |
10 |
|
2001 Apr 6-9 ^ |
54 |
36 |
3 |
7 |
|
2001 Mar 5-7 ^ |
58 |
29 |
6 |
7 |
C. Keeping America prosperous
|
|
|
FAIR/ |
|
|
|
% |
% |
% |
% |
|
|
2006 Mar 13-16 |
39 |
51 |
7 |
2 |
|
|
|
|
|
|
|
2005 Mar 7-10 |
47 |
43 |
8 |
2 |
|
2004 Mar 8-11 |
41 |
49 |
9 |
1 |
|
2003 Mar 3-5 |
44 |
45 |
7 |
4 |
|
2002 Mar 4-7 |
63 |
26 |
8 |
3 |
|
2001 Apr 6-9 ^ |
60 |
30 |
4 |
6 |
|
2001 Mar 5-7 ^ |
66 |
23 |
7 |
4 |
|
(vol.) = Volunteered response |
||||
|
^"Do you think George W. Bush will do a good job or a poor job in handling each of the following issues as president? How about -- [RANDOM ORDER]?" |
||||
23. How serious would you say the energy situation is in the United States -- very serious, fairly serious, or not at all serious?
|
Very |
Fairly |
Not at all |
No |
|
|
% |
% |
% |
% |
|
|
2006 Mar 13-16 |
41 |
51 |
7 |
1 |
|
|
|
|
|
|
|
2005 Mar 7-10 |
31 |
56 |
10 |
3 |
|
2004 Mar 8-11 |
29 |
57 |
12 |
2 |
|
2003 Mar 3-5 |
28 |
59 |
11 |
2 |
|
2002 Mar 4-7 |
22 |
63 |
12 |
3 |
|
2001 Jun 28-Jul 1 |
47 |
43 |
8 |
2 |
|
2001 May 7-9 |
58 |
36 |
4 |
2 |
|
2001 Mar 5-7 |
31 |
59 |
9 |
1 |
|
1991 Feb 7-10 |
40 |
44 |
14 |
2 |
|
1990 Sep 27-30 |
32 |
46 |
19 |
3 |
|
1990 Sep 10-11 |
28 |
48 |
21 |
3 |
|
1990 Aug 9-12 |
28 |
45 |
23 |
4 |
|
1979 Aug 3-6 |
47 |
35 |
16 |
3 |
|
1979 Jun 1-4 |
37 |
36 |
24 |
3 |
|
1979 Apr 27-May 4 |
44 |
36 |
16 |
4 |
|
1979 Feb 23-26 |
43 |
42 |
13 |
2 |
|
1978 Mar 31-Apr 3 |
41 |
39 |
15 |
5 |
|
1977 Nov 18-21 |
40 |
42 |
14 |
4 |
|
1977 Sep 30-Oct 3 |
40 |
40 |
16 |
4 |
|
1977 Aug 5-8 |
38 |
43 |
13 |
6 |
|
1977 Jun 3-6 |
40 |
42 |
13 |
5 |
|
1977 Apr 29-May 2 |
44 |
40 |
11 |
5 |
|
1977 Apr 1-4 |
41 |
39 |
16 |
4 |
24. Which of the following approaches to solving the nation's energy problems do you think the U.S. should follow right now -- [ROTATED: emphasize production of more oil, gas and coal supplies (or) emphasize more conservation by consumers of existing energy supplies]?
|
|
|
BOTH/ |
NEITHER/ |
|
|
|
% |
% |
% |
% |
% |
|
|
2006 Mar 13-16 |
35 |
55 |
6 |
1 |
2 |
|
|
|
|
|
|
|
|
2005 Mar 7-10 |
28 |
61 |
7 |
2 |
2 |
|
2004 Mar 8-11 |
31 |
59 |
6 |
2 |
2 |
|
2003 Mar 3-5 |
29 |
60 |
7 |
2 |
2 |
|
2002 Mar 4-7 |
30 |
60 |
6 |
2 |
2 |
|
2001 May 7-9 |
35 |
47 |
14 |
2 |
2 |
|
2001 Mar 5-7 |
33 |
56 |
8 |
1 |
2 |
|
(vol.) = Volunteered response |
|||||
25. Do you think that the United States is or is not likely to face a critical energy shortage during the next five years?
|
|
|
ALREADY |
No |
|
|
% |
% |
% |
% |
|
|
2006 Mar 13-16 |
56 |
39 |
1 |
4 |
|
|
|
|
|
|
|
2005 Mar 7-10 |
52 |
45 |
* |
3 |
|
2004 Mar 8-11 |
49 |
47 |
1 |
3 |
|
2003 Mar 3-5 |
56 |
40 |
1 |
3 |
|
2002 Mar 4-7 |
48 |
49 |
1 |
2 |
|
2001 Mar 5-7 |
60 |
36 |
1 |
3 |
|
1978 Nov 10-13 |
45 |
41 |
4 |
10 |
|
(vol.) = Volunteered response |
||||
14. Next, we'd like to know how you feel about the state of the nation in each of the following areas. For each one, please say whether you are -- very satisfied, somewhat satisfied, somewhat dissatisfied, or very dissatisfied. If you don't have enough information about a particular subject to rate it, just say so. How about -- [ITEMS A-T ROTATED, THEN ITEM U READ]?
F. The nation's energy policies
|
Very |
Somewhat |
Somewhat |
Very |
No |
|
|
% |
% |
% |
% |
% |
|
|
2006 Jan 9-12 |
5 |
24 |
28 |
27 |
16 |
|
2005 Jan 3-5 |
5 |
34 |
25 |
20 |
16 |
|
2004 Jan 12-15 |
6 |
40 |
25 |
16 |
13 |
|
2003 Jan 13-16 |
6 |
34 |
26 |
17 |
17 |
|
2002 Jan 7-9 |
6 |
39 |
27 |
15 |
13 |
|
2001 Jan 10-14 |
5 |
27 |
28 |
21 |
19 |
Commentary: