|
Ranking the Rich
Foreign Policy .com For the year 2004 The world's poor countries are ultimately responsible for their own development-and for years, rich countries have measured, categorized, scored, advised, and admonished them to cut their budget deficits, invest more in education, or liberalize their financial markets. Last year, the Center for Global Development (CGD) and FOREIGN POLICY turned the tables: We created the Commitment to Development Index (CDI), a ranking of rich nations according to how their policies help or hinder social and economic development in poor countries. One year and much additional data later, we unveil a second edition of the CDI that brings into sharper focus which governments lead the global community in the challenge of development. Why should rich countries care about development in poor ones? For reasons both pragmatic and principled. In a globalizing world, rich countries cannot insulate themselves from insecurity. Poverty and weak institutions are breeding grounds for public-health crises, violence, and economic volatility. Fairness is another reason to care. No human being should be denied the chance to live free of poverty and oppression, or to enjoy a basic standard of education and health. Yet rich nations' current trade policies, for example, place disproportionate burdens on poor countries, discriminating against their agricultural goods in particular. Finally, the countries ranked in the CDI are all democracies that preach concern for human dignity and economic opportunity within their own borders. The index measures whether their policies promote these same values in the rest of the world. In order to rank rich nations as accurately as possible, this year the aid, trade, and environment components of the index were revised, a technology component added, and the sections on investment, migration, and security (formerly called peacekeeping) overhauled. Australia gains most from these improvements in method, surging from 19th place in 2003 to 4th place this year, due in part to changes in the investment and security components. The new measure of security also helps boost the United States 13 slots; Australia, the United States, and Canada all gain from improved data on migration. Amid all the jockeying, however, the same stalwarts anchor first and last place: Japan remains at the bottom of the CDI while the Netherlands stays at the top, though it now shares that position with last year's number two, Denmark. Some governments got the CDI's message last year. For example, the Dutch government has adopted the CDI as one of its external performance standards for development and is now drafting a report on how it can improve its score. But despite such encouraging signs, underlying realities appear to have changed little. True, most donor countries gave more aid in 2002-the last year for which data are available-than in 2001. And under the aegis of the World Trade Organization (WTO), rich nations came to agreement on permitting poorer countries to import "generic' copies of patented pharmaceuticals, thus opening the door to cheaper AIDS drugs for Africa. However, rich countries-led by the United States, Japan, and France-remained intransigent on removing their agricultural tariffs and subsidies, contributing to the collapse of WTO negotiations in Cancún, Mexico, in September 2003. And international efforts to reduce harmful greenhouse gas emissions also suffered when Russia joined the United States in blocking the passage of the Kyoto Protocol. Ultimately, for all the CDI's focus on winners and losers, no wealthy country lives up to its potential to help poor countries. Generosity and leadership remain in short supply. THE ELEMENTS OF DEVELOPMENT The CDI assesses seven major domains of government action: foreign aid, trade, investment, migration, environment, security, and-new this year-technology policy. How much foreign aid do countries give and to whom? Do rich nations erect high trade barriers to products made in the developing world? How do they treat the global environmental commons? Each country is scored in each area and averaged to arrive at a country's final ranking. The index ranks Australia, Canada, Japan, New Zealand, the United States, and most of Western Europe in their effort and leadership in promoting development in poorer countries-not their absolute impact. For instance, one cannot expect Denmark to give as much foreign aid to poor countries as Japan (whose economy is 20 times bigger), but one can ask Japan to give as large a share of its gross domestic product (GDP) as Denmark does. Aid | Foreign aid is the national policy most commonly associated with development efforts. In 2002, total aid flows from rich countries to poor ones reached $58 billion. Rich countries provide poor ones with grants, loans, food, and technical advice to support everything from massive infrastructure projects to immunization programs in tiny rural villages. Most comparisons of aid examine simple measures such as total assistance as a percentage of the donor's GDP. The CDI goes further, by considering the quality and not just the quantity of aid provided. For starters, the CDI discounts "tied aid,' whereby donors require recipient countries to spend their aid on goods and services such as tractors or educational consultants from the donor nation. (Tying aid can raise the costs of any given development project by 15 to 30 percent by preventing recipients from shopping around for the best deal.) The index also subtracts all debt payments received from developing countries on aid loans, rewarding donors that forgive poor countries' debts. Choice of recipient countries is considered too: The CDI rewards aid to countries that are relatively poor yet relatively uncorrupt and accountable to their citizens. The CDI also penalizes donors for overloading governments in poor nations with onerous aid reporting requirements and countless "mission' visits from foreign aid officials. For example, Mozambique, with its combination of high poverty and relatively good governance, has attracted much donor interest in recent years, resulting in 1,413 new aid project commitments between 2000 and 2002. That amount is more than India (1,339 new projects) and China (1,328), countries with vastly more administrative staff to manage relationships with donors. Rich nations help Mozambique more when they jointly fund a few large-scale programs in, say, education or health. Last year, Tanzania even declared a four-month "mission holiday,' during which the country received only the most urgent visits by donor officials. Evidently, Tanzanian officials needed some peace so they could get work done. This year, the CDI rewards governments for allowing their citizens to write off charitable contributions on their income taxes-and for taxing their citizens less, leaving more money in private hands for charity. Some of those contributions go to humanitarian organizations such as Oxfam and CARE that do important work in developing countries. Currently, all index countries except Austria, Finland, and Sweden offer tax deductions or credits for such contributions. However, even in the United States-often considered a stingy government donor and generous source of charity-private giving is small compared to public giving. U.S. government aid in 2002 was $13.3 billion, or 13 cents a day per U.S. citizen. U.S. private giving to developing countries was another $5.7 billion, less than six cents a day, two cents of which is attributed to U.S. tax policy as opposed to individuals' own decisions. In the end, factoring in tax policy only lifts the U.S. aid rank from 20th to 19th. Sweden led the aid component this year, followed closely by neighbors Denmark, Norway, and the Netherlands. All four governments scored above 10 (On a scale of 0 to 10 by virtue of the sheer amount given. Many of the CDI nations increased their foreign aid in 2002, especially the United States, which favored geopolitically important actors such as Turkey, Indonesia, Russia, and Afghanistan. But although the United States gives more aid than any other country in absolute terms, it still gives less aid in proportion to its size than any other rich country, and so finished near the bottom in this category. However, due to the penalty for overloading countries with projects, Greece and New Zealand scored below the United States. Evidently these countries spread their modest aid thinly, covering many countries with small projects and overburdening local administrators. Trade | The WTO negotiations in Cancún collapsed last September after an alliance of developing countries challenged rich nations over their agricultural subsidies and tariffs. Agriculture typically comprises between 17 and 35 percent of GDP in developing countries, compared with less than 3 percent in rich nations. When high-income countries tax food and subsidize their own farmers' production, they destroy markets for developing country farmers who lack such protection. Wealthy nations' tariffs on industrial goods also tend to hurt the poor, with high rates for the labor-intensive products that are the mainstay of developing countries. In 2001, the United States collected more in import duties from Bangladesh ($331 million, mainly on clothing) than it did from France ($330 million), despite importing 12 times as much from France in dollar terms. The index penalizes all such barriers. However, a few may soon fall: Rich countries must abolish their quotas on textiles and clothing made in developing countries on December 31, 2004, under the 1994 treaty that created the WTO. China may reap big benefits from greater access to Western clothing markets, but Bangladesh-which receives a large share of the quotas-may be hurt. Still, on balance, if rich countries eliminated all their trade barriers, the ranks of the global poor would shrink by more than 270 million over 15 years, estimates CGD Senior Fellow William Cline. For the second year in a row, the United States tops the index's trade score. Norway repeats its poor performance, due to extremely high agricultural tariffs. Although Norway supports poor countries with a generous foreign aid budget, it undermines that support with its high trade barriers. Investment | Foreign investment can distort development and feed corruption and violence. For example, Angola's government, which reaps massive oil revenues from foreign firms, has reportedly filched or misspent $4.2 billion in five years, equivalent to nearly a tenth of its annual GDP. However, foreign investment can also be a significant driver of development in poor countries. In China, India, and Mexico, foreign investors have brought not only money but technical and managerial know-how. This year's CDI investment component surveys what governments in rich countries are doing to facilitate investment flows to developing nations as well as ensure that investment promotes development. The index looks at two kinds of investment. The first is foreign direct investment, where a company builds factories or buys large stakes in companies overseas. Do governments offer political risk insurance to encourage companies to invest in poor countries whose political climate would otherwise be deemed too insecure? Do they avoid investment projects likely to harm the environment or exploit workers? Do governments help investors avoid double-taxation of profits earned in developing countries? The second type is portfolio investment, where foreigners buy securities traded on open exchanges outside their home country. Do countries help create securities markets and institutions? Do they allow domestic pension funds to invest in developing countries? Ireland places last on the investment ranking this year in part because it does not provide political risk insurance or help investors avoid double-taxation. In contrast, the top-ranked Netherlands does both, although its insurance program does not screen for environmental and labor problems. Migration | Rich countries frequently tout free trade's positive impact on economic development. The basic arguments for freer trade apply to migration as well. People who move from poor countries to rich ones usually earn more in their new homes and send money back to support their families. For example, Latin American and Caribbean economies received $32 billion in remittances in 2002, six times what they received in foreign assistance. Remittances accounted for nearly 30 percent of Nicaragua's GDP in 2002, and 25 percent of Haiti's. The impact on poor countries when professionals leave-the so-called "brain drain'-is more complex. For instance, the exodus of doctors and nurses from Ghana and South Africa has devastated these countries. However, sometimes professionals gain skills abroad and then move back home: Returning Indian expatriates are playing a big role in that country's software and services boom. Even when professionals remain abroad, they often retain links with industry and research at home. Unfortunately, insufficient data prevent the index from distinguishing between skilled and unskilled migrant flows. So, the CDI relies on the core conviction that freer movement of people, including those with considerable professional skills, benefits development overall. The migration component has improved since last year; it now measures not only how many migrants come to rich countries but how many leave, better reflecting whether immigrants stay long enough to put down roots, send home substantial sums, and pick up real skills. The 2004 CDI estimates the net flow of immigrants from developing countries in a five-year period, 1995 to 2000. Because of this change, Canada bumped Switzerland and New Zealand off their perch as the most migrant-friendly countries. Switzerland in particular admits many people from developing countries-but many of them leave soon after. In contrast, the migrant population is growing steadily in Canada, as well as in Australia and the United States. The CDI also considers openness to students, refugees, and asylum seekers from poor countries. Environment | Citizens in rich countries often think of environmental protection in terms of preserving the world for their children and grandchildren-people who do not participate in today's environmental degradation but who will suffer its consequences. Yet today's global poor are already harmed by irresponsible environmental policies. Rich countries are the primary users of scarce global resources, but poor countries are the most likely to be hurt by ecological deterioration and the least capable of adapting. These countries typically have weak infrastructures and social services, making them particularly vulnerable to the floods, droughts, and spread of infectious diseases that global climate change could bring. The index assesses whether countries are reducing their depletion of shared resources and contributing to multilateral efforts to protect the environment, such as the Montreal Protocol fund established in 1990 to help developing countries phase out ozone-depleting chemicals. This year, Switzerland retained its hold on first place in this category because of its low greenhouse gas emissions. The United States remained in last place because of its high emissions and low taxes on gasoline. Denmark, France, and the United States picked up about half a point each for ratifying the latest international agreement on protecting the ozone layer, known as the Beijing Amendment, in 2003. Security �| As recent events in Liberia and Haiti demonstrate, rich countries' military power can protect developing countries' citizens from the violent upheaval that political instability and civil conflict too often create. Internal instability can take a terrible toll on people's well-being: Children forced into armed rebel groups in Sierra Leone and Uganda during the 1990s lost their childhood, chance for education, and in many cases, their lives. Instability also undermines economic and political development, robbing entire countries of their future. The CDI tallies the financial and personnel contributions that governments have made to peacekeeping operations and (new this year) forcible humanitarian interventions. Because the merits and motives of such interventions are often highly controversial, the CDI filters out operations lacking approval from international bodies such as the U.N. Security Council or the African Union. After extensive data gathering, the CDI now considers a country's history of contributions over a decade-instead of two years-to assess its current willingness and ability to participate. Australia's 4,500-troop intervention to stop the Indonesian military's oppression of the East Timorese in 1999 (a large deployment for a country the size of Australia) earns that country third place. Surprisingly, the United States comes in only 11th, despite contributing more than 50,000 personnel to interventions in Haiti, Somalia, Kosovo, and Bosnia. By the standards of its peers, this is not a large contribution after adjusting for economic size. Because data are incomplete for 2003, U.N.-approved postwar security aid for Iraq is not included this year-but it could be next year. The invasion of Iraq, however, will not be counted because no major international body approved it. Japan and Switzerland rank at the bottom of the component, due to Switzerland's traditional neutrality and Japan's constitutional limits on military interventions. Technology | Arguably, the most profound long-term effect of rich countries on poorer countries' development comes from new technologies. East Asian countries have enjoyed near-miraculous growth, halving poverty rates between 1975 and 1995, thanks in part to their production of electronic goods originally invented in rich countries. Moreover, vaccines and antibiotics led to major gains in life expectancy in Latin America and East Asia in the 20th century; these regions achieved in only four decades improvements that took Europe almost 150 years. Cell phones have revolutionized communications in poor countries such as Nigeria. The Internet also helps developing countries access and disseminate information, form civil-society movements, and trade with rich economies. To capture the government's role in encouraging globally beneficial innovation, the CDI's new technology measure counts total government subsidies for research and development (R&D)-whether delivered through spending or tax breaks-as a share of GDP. Unfortunately, few data are available on the amount of R&D funding in areas most relevant to the world's poorest populations, such as malaria vaccines and tropical agriculture. The index discounts military spending on R&D by 50 percent because, while some military innovations have useful civilian spin-offs (including the Internet), much military R&D does more to improve the destructive capacity of rich countries than the productive capacity of poor ones. Austria and Canada come out on top of the CDI technology component, with their governments spending 0.9 percent of GDP on R&D (discounting for military R&D). Greece and Ireland finish last with 0.3 percent. The U.S. government actually devotes the most to R&D as a share of GDP, but half of that is military, so the defense penalty pulls the country to seventh place. ROOM FOR IMPROVEMENT A quick scan down the final column of the 2004 CDI rankings reveals big changes in standings since last year. But changes in rankings reflect almost entirely improvements in methods and measures. The bottom line, as was the case last year, is that every country's performance is mediocre or worse in at least one area. Even the highest-ranking countries could do much better. When rich countries improve the health of other countries, their own outlook will improve as well. A prescription for the CDI countries in the coming year would include abolishing agricultural subsidies and tariffs, legalizing more migrant flows, and giving more aid to countries based on their needs and prospects, not on narrow geopolitical interests. There is tremendous room for all rich countries to demonstrate true leadership in support of global development. Each country's overall score on the CGD/FP Commitment to Development Index is the average of its scores in seven categories: trade, technology, security, environment, migration, investment, and aid. Three fourths of the trade score is based on barriers to exports from developing countries-tariffs, quotas, and subsidies for farmers in rich countries. Higher barriers yield lower scores. The remainder measures how much rich nations import from developing countries. Imports from the world's poorest nations receive greater weight, as do manufactured imports from all developing countries. The technology component measures government support for research and development (R&D) as a percentage of GDP, including direct spending and tax subsidies. Defense-related R&D is discounted by half. The security score rewards participation in peacekeeping operations and forcible humanitarian interventions during 1993-2002, counting only military operations approved by international bodies such as the U.N. Security Council or NATO. Military operations are assessed and converted to dollar terms based on the size of countries' defense budgets and share of standing forces committed. Two thirds of the environment component reflects harm done to the global commons, factoring in consumption of ozone-depleting substances, subsidies for fishing, emissions of greenhouse gases, and low gasoline taxes. The remaining third rewards contributions to international initiatives, such as ratification of major environmental treaties and donations to funds that help developing countries meet international environmental goals. The net inflow of people from developing countries to wealthy ones between 1995 and 2000 accounts for 65 percent of the migration score. The percentage of students from developing countries among the total foreign-student population in rich countries counts for 15 percent, and aid to refugees and asylum seekers counts for 20 percent. The investment component rewards policies that encourage helpful investment into developing countries. Eighty percent of the score recognizes policies promoting appropriate foreign direct investment, such as political risk insurance and rules preventing double taxation. The remaining points reward long-term portfolio investment. Finally, the aid component assesses total official assistance-grants and low-interest loans-as a percentage of the donor country's gross domestic product (GDP). It discounts by 20 percent aid that is "tied' to the purchase of goods or services from the donor nation, and subtracts debt payments received on past aid. The index penalizes donors based on the share of aid commitments made in amounts less than $100,000, which tend to overburden poor governments. Rich countries with tax incentives that encourage private charitable contributions gain points. They also win points simply for having lower taxes (relative to Sweden, the country with the highest taxes as a share of GDP), because higher post-tax income leads to more private giving. A comprehensive explanation of the index's methodology is available on the Center for Global Development's Web site at www.cgdev.org . The CGD/FP Commitment to Development Index (CDI) ranks rich countries on how their policies help or hurt prospects for development in poor nations. Scores on each component of the CDI generally land between 0 and 10, but readers will spot a few scores above 10 and one below 0. How did that happen? Each component of the CDI combines many numbers into a single score and places that score on a standard scale. The scales are adjusted so that the average score in each category is always 5. This adjustment makes it easy to note that Japan's policies, for instance, are above average on technology (with a score of 5.4), but not as strong on environment (4.5), by the standards of its peers. If a country is twice as good as average, it scores a 10, and if it's more than twice as good, it scores above 10. In the 2004 CDI, Denmark, the Netherlands, Norway, and Sweden receive such high marks on aid. That also happens with Canada and the United States on migration, as befits these nations of immigrants. Extra credit, you could say. The opposite is true for the environment and trade components of the index. Whereas scores on components such as security start at 0 (meaning no security contribution) and go up from there, scores on environmental pollution and trade barriers begin at 10 (no emissions or barriers) and go down from there. Just as a country can power through the 10-point ceiling by giving more aid or admitting more immigrants, it can also break through the floor of 0 by emitting enough pollution or imposing high tariffs. Norway enforces enough tariffs to earn a dismal score of -2.7 on trade. The country's tariffs and quotas on imports, as well as its subsidies for its own farmers, constitute an average tariff of 32 percent on all imports, almost three times the 11.8 percent average for all countries ranked in the CDI. Norwegian tariffs are particularly high on agricultural products-an estimated 155 percent on rice imports, 334 percent on wheat, and 351 percent on beef. Helping poor countries is about more than giving money-it's about taking responsibility for policies that affect those less fortunate. The 2004 CGD/FP Commitment to Development Index ranks wealthy countries' positions on a range of issues that influence the development of poor countries. 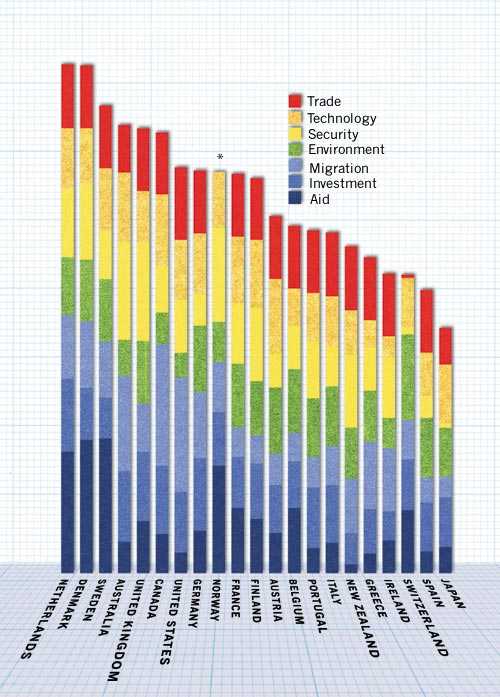
The CDI rewards countries that encourage charitable donations through tax deductions and credits. Yet public giving dwarfs private giving in all countries surveyed. Even the United States, whose citizens are generous givers, gained few points on the aid scale. The chart below compares government aid and private giving on a daily per person basis.
The Commitment to Development Index penalizes wealthy nations for overloading poor nations with aid projects that strain governments' administrative capacities and dilute the impact of the projects. Between 2000 and 2002, aid agencies in rich countries committed to funding 1,371 different projects in Tanzania. That is a lot for a small government in a poor country to juggle. For example, Switzerland committed $29.7 million through just five projects, whereas Ireland offered roughly the same amount of total aid, but through 404 different projects. The bars reflect the total aid each donor country gave to Tanzania. The cells within each bar reflect the number of different aid projects each country funded. 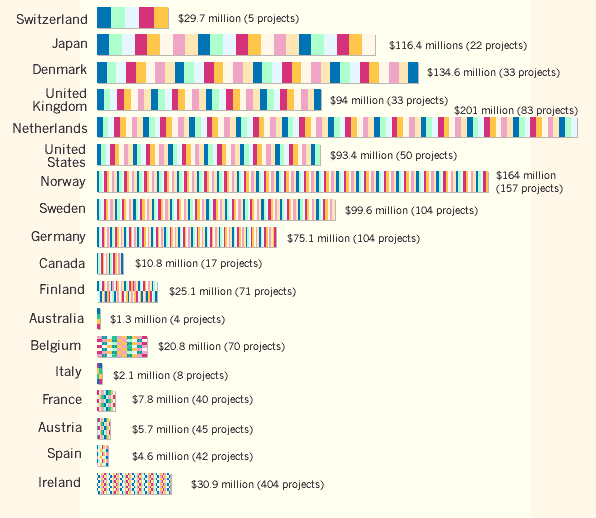
Why are these 21 countries scored? Who designs the CDI? How did you decide what to include in the index? Did the CDI change much between 2003 and 2004? Should the 2004 "winners' be proud? How did you decide how to weight the components? Why aren´t aid
and trade given more weight? Don´t the United States and Japan give more aid to developing
countries than any other rich country? How can they rank so poorly on aid? Why
do small countries such as Denmark and the Netherlands rank so
well? Why do some countries score over 10 on aid or migration? Why does
Norway score negatively on trade? Where do the data come from? Over what time frame is support for development
measured? Why doesn´t the migration component include remittances? Why
doesn´t it factor in the brain drain? How does the CDI handle the invasion of Iraq? Why did some countries move up or down so much in the standings
since 2003? Will the index be available next year? Commentary: |
 |
||||||||||||||||||||||||||||||||||||||||||||||||||||||||||||||||||||||||||||||||||||||||||||||||||||||||||||||||||||||||||||||||||||||||||||||||||||||||||||||||||||||||||||||