|
|

This image can be used with permission
and must carry a copyright notice.
Reagan Versus Clinton
Statistics
1981-1988
1993-2000 |
|
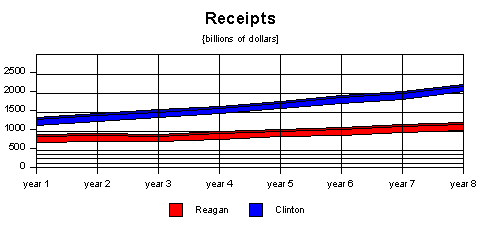
Receipts during the Reagan years increased by $310 billion and by $870.8
billion under Mr. Clinton. This chart show a sharp and steady increase in
revenue under Mr. Clinton which may have helped him return us to fiscal
responsibility.
Two conservative myths bite the dust in this category. First, tax increases
do NOT decrease revenue and tax cuts do not increase revenue more than tax
increases. Conservatives also argue Mr. Reagan doubled revenue. This is NOT
correct.
In 1993 President Clinton signed into law his economic plan which called for
$250 billion in tax increases and $250 billion in spending cuts. Every
republican in both Houses of Congress voted against the legislation. However,
after republicans took control of congress in 1995 they didn't repeal the tax
increases. This fact alone suggest very strongly that their first vote was pure
politics and they really didn't want to balance the budget. That vote along
with the tax cuts they passed under Mr. Reagan and Mr. Bush suggest very
strongly they use the government purse to buy power.
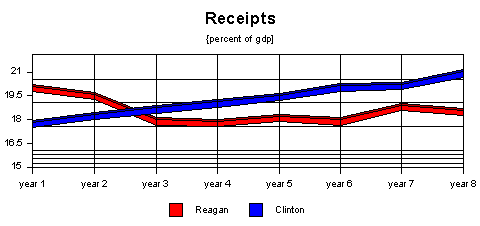
As a percent of the economy receipts grew under Mr. Clinton and shrank under
Mr. Reagan. When one considers Mr. Reagan promised a balanced budget in four
years, but instead gave us the largest deficits in US history (until Mr. Bush)
not only was it a broken promise, but these charts and those that follow
disassemble many if not all of what conservatives say they stand for.
Conservatives, like Reagan did not believe in a balanced budget. The
deficits created under Mr. Reagan are nothing more than future taxes plus
interest. A reasoned individual would never give the present generation tax
cuts while saddling the next with massive tax increases. But, this is exactly
what Mr. Reagan and his conservative allies in Congress did.
It's important to understand that higher receipts gave us the massive
surpluses, not less spending. Also, more growth in the economy didn't give us
higher receipts since both presidents gave us
about the same amount of growth. Two more conservative
theories bite the dust.
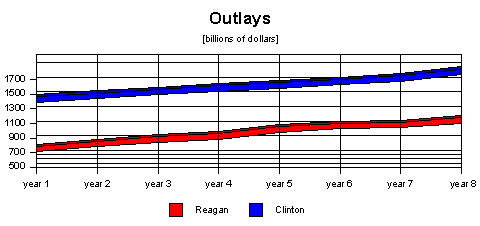
Spending during both presidencies was about the same. Mr. Reagan increased
spending by $386.3 billion while Mr. Clinton increased spending by $379.3
billion. However, Mr. Clinton was forced to spend far more money to finance the
debt than Mr. Reagan. When Mr. Reagan began his term we were spending only $112
billion a year to finance the debt. In 2000, Mr. Clinton had to spend $225
billion. See Interest on the Debt. On the other
hand, Mr. Reagan had the luxury of spending on whatever programs he wanted
(since the deficits didn't really matter to
him), including the biggest pork program in the government...the US
military.
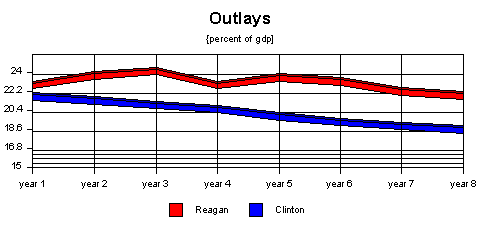
The striking difference between the two presidents can be seen here. Mr.
Reagan began his presidency on a spending spree, increasing spending as a
percent of the economy every year through 1985 (the year after his reelection).
For the rest of his term spending declined. It should be noted Iran/Contra
broke in late 1986 and the republicans lost control of the Senate in the same
year.
So a republican president and congress gave us massive spending and our
highest deficits for six years, but spending was dramatically cut after the
democrats regained control of the Senate in 198S7.
Spending under Mr. Clinton declined every year.
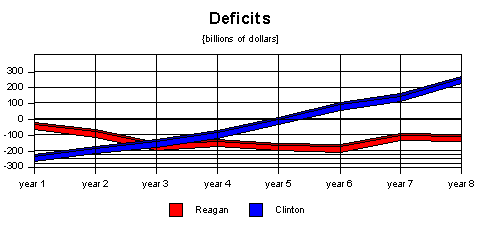
No matter how we cut it, the rise in the surplus during the Clinton years
was truly historic. Mr. Reagan however, was unable to trim a single penny from
the deficit from where it was when he began his presidency. Mr. Clinton cut the
deficit every year until we had record surpluses.
The falling deficits freed up needed capital for the economy to grow and the
Clinton Investment Led Super Boom began. Stocks rose at
historic levels and continued to do so throughout his presidency.
The surplus of $274.1 billion in 2000 was in marked contrast to the record
-$290 billion deficit in 1992 and -$274.1 billion in 1993 under Mr. Clinton.
Mr. Reagan increased the deficit in dollars every year except 1987 and 1988,
the two years democrats controlled the Senate. Mr. Clinton cut the deficit
every year.
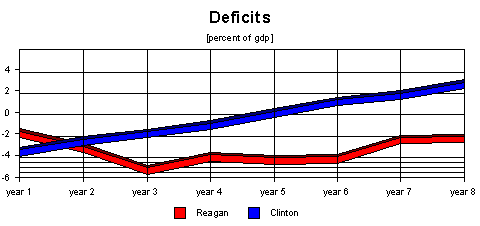
Deficits as a percent of our economy shrank every year under Mr. Clinton and
as you can see from the chart never recovered from the Reagan spending spree
and tax cuts in the 1980's. Any evidence Mr. Reagan was for less government or
a balanced budget can not be found in the facts. Mr. Reagan spoke of both, but
delivered the opposite.
Oddly enough, Mr. Clinton was attacked by conservative republicans for his
spending programs. All one has to do is review the deficits under both
presidents to see which party and which president wanted more government and
more taxes (deficits are future taxes plus interest).
Deficits as a percent of gdp peaked in 1985 and fell every year after under
Mr. Reagan, while under Mr. Clinton deficits as a percent of the economy fell
eight years in a row.
By the time republicans got around to passing the balanced budget plan in
1997 for fiscal year 1998, the deficit was almost gone. Anyone attempting to
give them credit for the balanced budget is sadly mistaken. Their five-year
plan calls for our first balanced budget in 2002 ( a year Mr. Bush has once
again returned us to deficits). Their plan was only five years off. Our first
balanced budget occurred in 1998.
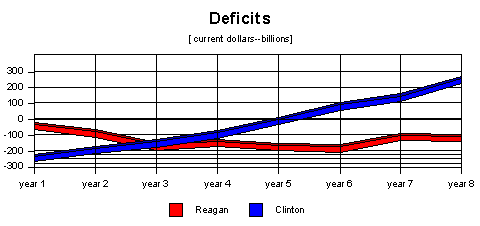
Deficits in current 1996 dollars are about the same as in the other deficit
chart (two up). This chart was included to show how similar they look.
The average deficit in current dollars was -$167.34 under Mr. Reagan and
-$34.6 under Mr. Clinton.
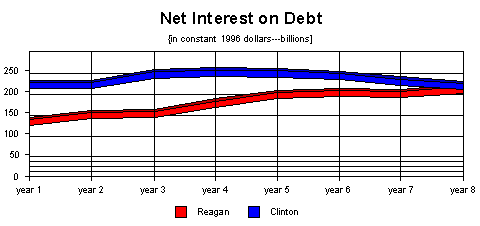
As stated earlier, the cost of deficit spending during the Reagan and Bush
years sucked an enormous amount of money out of the economy. Interest costs peaked in 1996 under Mr. Clinton, then fell
every year afterwards. Costs never declined under Mr. Reagan.
When conservatives tell you deficits don't matter...remember this chart and
the numbers. Someone has to pay more taxes to finance all the debt
conservatives give us with their tax cuts. Mr. Reagan gave us more debt than
all previous president combined and therefore the largest future tax increase
of all previous presidents combined. Mr. Bush gave us the largest deficits in
US history. Mr. Clinton returned us to fiscal responsibility (tax and spend,
instead of spend and borrow) and the largest surpluses in US history.
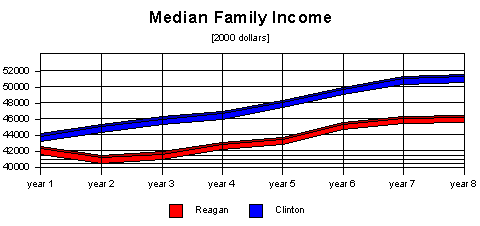
Another area of extraordinary success during the Clinton years is the rise
in median family income. Income rose $3,900 under Mr. Reagan and $7,418 under
Mr. Clinton (in 2000 dollars). This is one time when a picture isn't worth a
thousand words. The increase under Mr. Clinton were almost twice that of Mr.
Reagan.
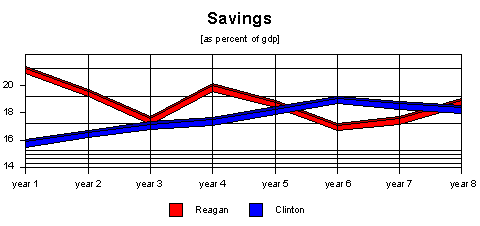
I'm not too sure why some think the savings rate is important when so many
Americans have money invested in the stock market. The markets clearly out
perform savings accounts so I'm not sure what all the fuss is about. But a
quick look at the numbers shows us the saving rate averaged higher under Mr.
Reagan but it fell almost every year of his presidency. It never rose to where
it was in 1981, the first year of his term.
By contrast savings increased every year under Mr. Clinton except the last
two but the increase in savings was dramatic. Savings increased 2.5% under Mr.
Clinton and fell 2.4% under Mr. Reagan.
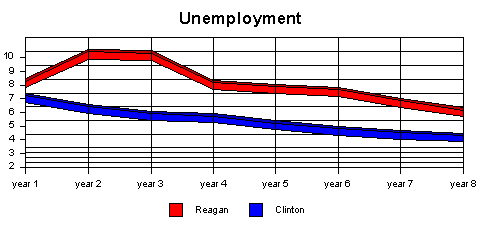
Unemployment declined on average for both presidents. The spike in years 1-3
are a result of a very severe recession. Mr. Reagan presided over the highest
unemployment rate since 1941 in 1982 and 1983. Unemployment peaked in 1982 but
remained historically high throughout his presidency. Average unemployment
under Mr. Reagan was 7.54% and 5.20% under Mr. Clinton. Mr. Clinton gave us the
lowest unemployment rate in 30 years.
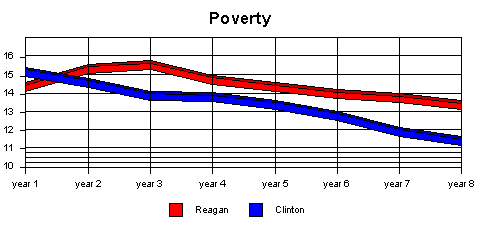
Another major success of the Clinton years is the drop in poverty. Poverty
dropped 3.8% under Mr. Clinton and 1% under Mr. Reagan (beginning term to
ending term). Average poverty was 13.28% under Mr. Clinton and 15.82% under Mr.
Reagan or 2.54% lower under Mr. Clinton on average (15.82-13.28=2.54). However,
it should be noted the recession caused poverty to spike up 1.2% in years two
and three (1982 and 1983) under Mr. Reagan.
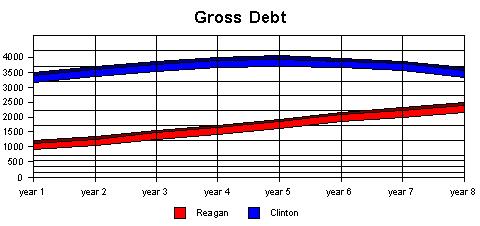
By the first year of Mr. Reagan's term the US has accumulated $994.8 billion
in debt from all previous years. In just eight years Mr. Reagan increased the
debt to $2.6 trillion or an increase of $1.6 trillion. This figure represents
the largest accumulation of debt of any president in history and almost twice
as much debt as all previous president combined.
Mr. Reagan gave us more debt than any president in history.
Mr. Bush promised to pay down the debt in 10 years but in 2002 projects
he'll increase it by over $2 trillion. Knowing what I know about republican
presidents they seem to always under project what they're going to spend. Thus,
it's highly likely the debt projections will increase over the next three
years.
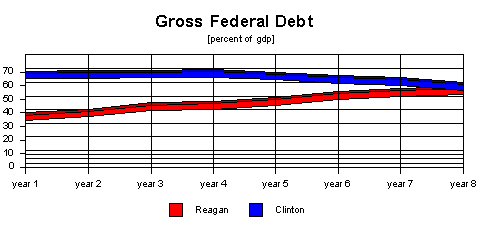
This category clearly shows the successes and failures of the two
presidents. Total debt as a percent of our economy grew from 25.8% to 40.9% in
eight years under Mr. Reagan. This debt represents future taxes plus
interest.
Under Mr. Clinton the debt dropped from 49.5% of gdp to 35.0%. While Mr.
Clinton wasn't able to completely undo the fiscal disaster of Mr. Reagan he
began the process. It's now up to a future president to decide if this success
will continue or if deficits and debt will once again be with us.
Under Mr. Bush the debt as a percent of the economy is projected to increase
from 56.8% of the economy to 58% by 2007. Placing this in historical
perspective, the debt dropped throughout the 50's, 60's, and 70's then began a
steep increase from 1982-1996. From 1997-2001 the debt dropped again and is
once again going up. Clearly republican tax cuts and spending programs are
having a devastating effect on this number.
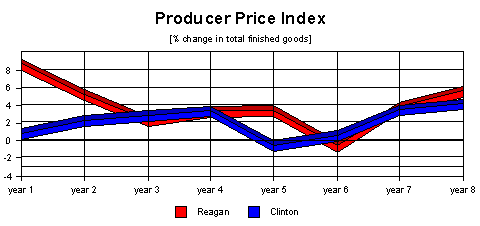
The producer price index is hard to follow since Mr. Reagan began his term
with very high prices from the oil embargo during the Iranian Hostage Crisis.
The US had placed an embargo on all Iranian oil and it resulted in a massive
increase in inflation, stagflation and eventually dual recessions in 1980 and
1982. The high prices in 1981 (year 1) of Mr. Reagan reflect this oil
shock.
After the first recession, or beginning in 1980, all prices began to fall.
More on this in Finished Energy Goods. Because of the oil
shock in the first two years of Mr. Reagan it would be unfair to use an average
to judge the two presidents. However, there are a few interesting points about
producer prices. Both presidents saw a massive drop in the index at about the
mid point of their two terms. Mr. Reagan in year six and Mr. Clinton in year
five. After the drop in the index, both presidents saw years of increases, with
Mr. Reagan ending his second term at 4.0% and Mr. Clinton at 3.6%.
It's important to note that producer and consumer prices began to fall
dramatically in 1980, long before Mr. Reagan's policies took effect in fiscal
years 1982 and 1983. Any attempt to suggest Supply Side Economics caused the
decline in inflation is not supported by the facts.
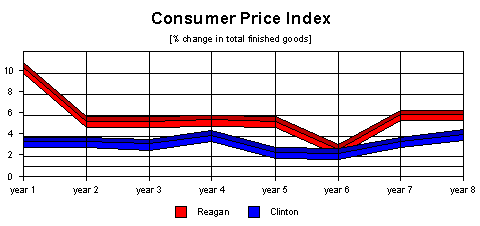
Consumer prices began in 1983 (year one) much like producer prices under Mr. Reagan. Very high. The recessions in
1980 (very short) and 1982 (very severe) resulted in a major drop in producer
and consumer prices. Some like to credit Mr. Reagan's economic policies for the
drop in prices. This is simply not true. Prices always come down during
recessions and Mr. Reagan was projecting record growth in 1981 and 1882. The
opposite happened. To give him credit when he expected the opposite is
intellectual dishonestly.
Consumer prices and producer prices follow each other almost exactly. In
year 6 under Mr. Reagan we saw a major drop. In years 5 and 6 under Mr. Clinton
we saw major drops. At the end of each man's term the indexes were 4.4%
increase under Mr. Reagan compared to a 3.4% increase under Mr. Clinton. In
other words, prices were going back up...just prior to (what this author
believes) Fed induced recessions, one in 1991 and the other in 2001.
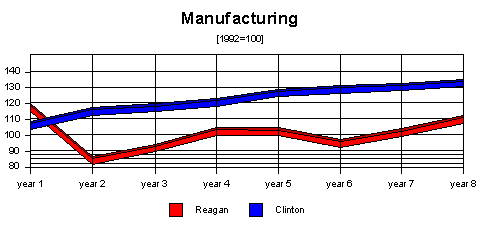
Manufacturing rose considerable faster under Mr. Clinton. Mr. Reagan however
had a slight dip during the recession in 1982 and 1983 (years 2 and 3). The
explosion of growth in manufacturing is another clear sign that Mr. Clinton's
policies were far more successful than Mr. Reagan's. Some argue it was the
dot.com's, but this is incorrect. The NASDAQ, which
represented the dot.com's wasn't the only index that rose. More on this in the
four stock indexes. One needs to recall it was during the
1980's cable TV began. The boom to the economy from that new technology is
often forgotten when making comparisons between the 1980's and the 1990's.
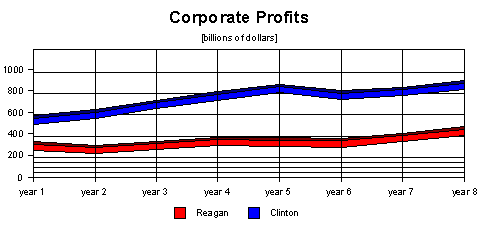
Not only were the Clinton policies good for the budget, but corporate
America also enjoyed some very good times. In this chart we can better see this
success. Corporate profits increased by $143.5 billion under Mr. Reagan and a
whopping $326.6 billion under Mr. Clinton. The dip in profits in 1982 and 1983
(years 2 and 3) under Mr. Reagan were caused by the recession. On the other
hand, corporate profits peaked in 1997 (year 5) under Mr. Clinton, then dropped
slightly before continuing to soar. More research needs to be done to determine
the causes of this dip. However, it needs to be noted strongly the dip lasted
just two years before posting record profits in the last year of Mr. Clinton's
term.
This number always blows me away. Corporate profits in the US were $833.0
billion in 2000. The rest of the world had $136.8 billion (Table B-11--Economic
Report of the President, 2002). Putting this in perspective, at the end of Mr.
Reagan's term US corporations had $303.1 billion more profits than the rest of
the world combined. In the final year of Mr. Clinton, corporations had $696.2
billion more. Not bad in just eight years.
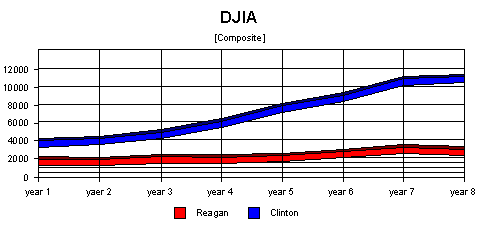
A picture is worth a thousand words. This index like those that follow, show
a dramatic increase in investments. The DJIA tracks 30 stocks. The Investment
Led Super Boom of the Clinton years is truly historic. Those who think hi-tech
(mostly in the NASDAQ) fueled our economic boom are sadly
mistaken. The boom was in almost every type of stock including the Dow Jones
Industrial Average. Note the drop in year 8 (1988) under Mr. Reagan. This was
years before the recession so it can't be blamed on that. Also, note the
massive high in 2000 under Mr. Clinton, less than a year before another
recession hit. The current recession (2002) will be very weak compared to the
Reagan recession because the economy was so strong going in to it. Unemployment
too was far higher prior to the Reagan recession than the recessions under Bush
Sr. and Bush Jr.
The last three recessions came under republican presidents, Reagan in 1981,
Bush is 1991 and Bush in 2001. Stocks suffer minor losses during recessions and
recover quickly on average.
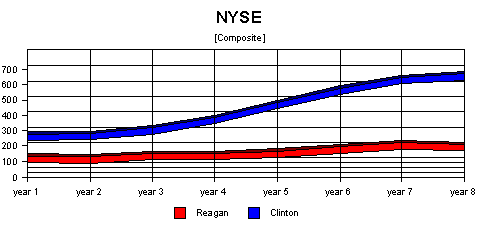
The Dow and the New York Stock Exchange follow each other almost exactly.
The NYSE includes nearly 3000 stocks. It always nice to see some things don't
change. The NYSE continues to show the dot.com's were not the only reason for
the historic economic prosperity during the Clinton years. Lower deficits and
higher surpluses clearly have a positive effect on investments. When will
investors learn this? Tax cuts and their resulting deficits do long-term damage
to the economy...always have and always will.
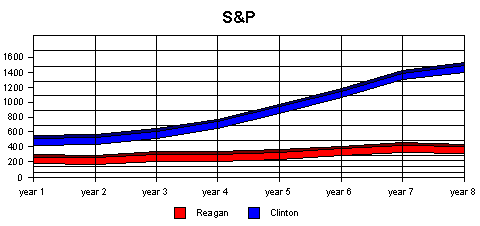
The Standard and Poor's Composite includes 500 stocks. The trends in this
index reflect the previous two indexes almost exactly. In all three indexes Mr.
Clinton's blue line is far higher than Mr. Reagan's. The Investment Led Super
Boom of the Clinton years can easily be seen in this category. Tax cuts under
Mr. Reagan did not produce the growth in investments needed for long-term
growth because any illusion of growth created by excess spending (deficits)
actually keeps interests rates high and therefore suppresses growth. There is a
direct and provable correlation between investment increases, interest rates and government surpluses.
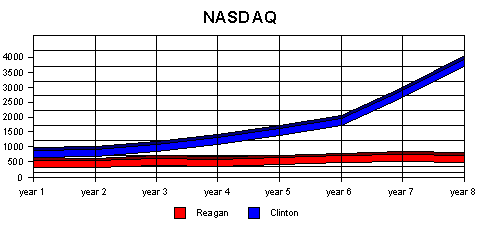
Now we have something odd happening. Note the differences beginning in year
6 under Mr. Clinton compared to the other three indexes. This is the dot.com
stuff everyone likes to talk about. The NASDAQ represents over 4000 stocks and
is the home of most high-tech stocks. The growth in the last three year under
Mr. Clinton should not be confused with the growth in the rest of the economy
or the recession beginning in March of 2001 since the growth was wide spread in
almost every part of our economy...including manufacturing.
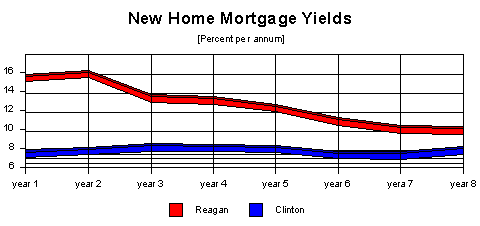
A person needs to look at the actual numbers on the statistics page to see just how successful Mr. Clinton
was in this category. The lower deficits and surpluses gave us far lower
interest rates under Mr. Clinton than Mr. Reagan, though historically high.
However, the Fed most likely used its power to harm the economy twice during
the Clinton years. After the Clinton tax increase in 1993, the Fed raised rates
six times over two years. This gave republicans all the ammunition they needed
to go after democrats who controlled both Houses of Congress and the
Presidency. The Fed did this for one of two reasons. Either they really thought
deficit reduction was a bad thing (because deficits fell during those years),
or the Fed increased rates to help republicans gain power.
This is no data to suggest interest rates had to increase in 1993 or 1994
except political. Mr. Greenspan masterminded the republican take-over of
congress in 1994.
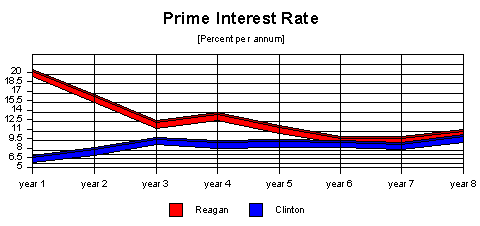
During a period of slow growth and deficit reduction the Fed felt a need to
increase interest rates in 1993 and 1994. After six years of deficit reduction,
higher than average growth and record surpluses the Fed felt it necessary to
increase rates yet again in 1999 and 2000.
After Mr. Dole's tax didn't sell in 1996, Mr. Greenspan began a process a
couple years later to slow the economy enough for Mr. Bush's tax to sell. It
worked. Beginning in 1999 the Fed increased interest rates for two years (even
though we had the largest surpluses in US history). The only possible reason
for these increases can be political. Mr. Greenspan not only planned the Bush
Presidency but he also masterminded the Greenspan tax cut. As soon as Mr. Bush
became president, Greenspan lowered rates again. He did the exact same thing
after republicans took control of the congress in 1995.
The US has never witnessed an economic coup of this magnitude and hopefully
will never see it again. The time to get rid of the Fed is now.
For eight years under Mr. Clinton, Mr. Greenspan opposed spending increases
or tax cuts. As soon as Mr. Bush became president he favored a tax cut. That
tax cut now has given us projections for another decade of deficits and debt.
Years of Clinton success were undone by Greenspan and Bush. Let history decide
their fate.
One can only imagine how much faster the economy would have grown if the Fed
had refused to screw with the economy in the 1993-94 cycle and 1999-00 cycle.
The increased interest rates, especially at the end of Mr. Clinton's term (when
we had massive surpluses) represent a calculated attempt by the Fed to
determine the next president.
However, even with Mr. Greenspan's overt political agenda, the average prime
under Mr. Clinton was only 8.05% compared to 11.54% under Mr. Reagan. In the
end, not even the Fed could slow the Investment Led Super Boom of Mr.
Clinton.
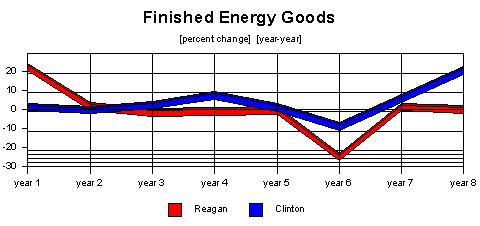
This category along with the one on the next page under the same name goes a long way in proving the Reagan
economic package did NOT end inflation. As you can see, prices for energy
related goods began to drop long before the Reagan plan had a chance to work.
His plan, passed in 1981 (year 1) for fiscal year 1982 (year 2) had little or
no effect on bringing prices down since they had declined so much before them.
Reviewing the historic data energy priced goods peaked (that is began to fall)
in 1980, two years before the Reagan plan
took effect.
Those who give Reagan credit, forget or choose to ignore this basic fact.
Adding to the so-called Reagan success on inflation is the massive recession in
1982. Both recessions, one in 1980 and one in 1982 did more to reduce the price
of energy goods and thus inflation than any other factor.
As the US and the global economy went into recessions the demand for oil
dropped. Lower demand caused prices to stabilize and eventually fall. Lower oil
prices lowered all other prices.
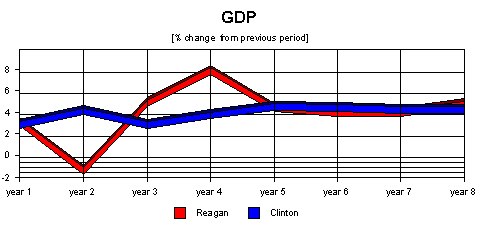
Average growth under both president's was very similar or 3.36% under Mr.
Reagan and 3.74% under Mr. Clinton. The huge spike in growth in 1983 (year 3)
under Mr. Reagan followed a severe drop in 1982 (year 2) from the recession.
The severity of the recession however (-2%) gave us two years of very strong
growth in years 3 and 4 as consumers began buying again after pent up
demand.
Without the huge spike following the recession, the growth rates under Mr.
Reagan would have been even lower. In an oddity, the recession was actually
better than not having a recession. After the recession the economy grew 7.3%
in 1984, the fastest during the 16 years period studied (or the 24 years under
Carter, Reagan, Bush and Clinton) after it contracted only -2% in 1982.
This category also puts to rest another conservative myth, that is that tax
cuts stimulate the economy. In reality we have no idea what people will do with
more money, they may spend, invest or save. But most Americans saw a major tax
increase under Mr. Reagan as he increased social security taxes in an attempt
to hide his growing deficit debacle.
The true success during the Clinton years must be placed in perspective. Mr.
Reagan was able to created the illusion of growth by growing government and
massive deficits. Mr. Clinton gave us real growth with falling deficits and the
rise of the largest surpluses in US history.
One is real success, the other is not.
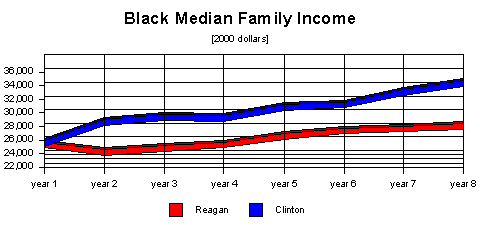
One of the less known facts about the Clinton presidency is the drop in
black poverty and the rise in black income. Some argue this was a result of
welfare reform, but they are wrong. Welfare reform was signed into law in
August of 1996 for fiscal year 1997 and beyond. By 1997 (year 5) black family
income had risen $3,655 a year or more than the entire eight year term of Mr.
Reagan.
Black family income rose $8,854 under Mr. Clinton and $2,669 under Mr.
Reagan. Average income was $25,031 under Mr. Reagan and $30,073 under Mr.
Clinton (in 2000 dollars).
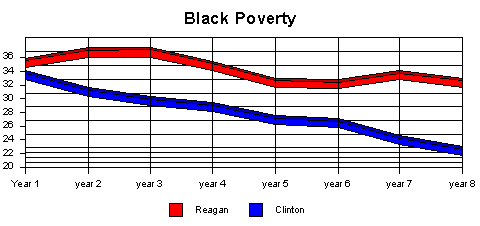
This category is truly amazing for the Clinton camp. Under Mr. Clinton black
poverty dropped 11.1% compared to 2.4% under Mr. Reagan. Those who suggest tax
cuts make the poorest of the poor better off, would be well advised to look at
the facts represented in this category.
 Author: Patrick Ziegler
February 12, 2002


