|
Energy Assistance Falls as Prices
Rise
Center on Budget and Policy Priorities OUT IN THE COLD: How Much LIHEAP Funding Will Be Needed to Protect Beneficiaries from Rising Energy Prices? By Richard Kogan and Aviva Aron-Dine October 6, 2005 Last year, Congress provided nearly $2.2 billion for the Low-Income Home Energy Assistance Program (LIHEAP). LIHEAP helps very poor households, many of whom are elderly, pay their home heating (and cooling) bills. Most of the assistance prevents heat from being turned off in northern states in the dead of winter, but some also keeps air conditioning running during southern heat waves. LIHEAP funding covers just a fraction of the poor households eligible for assistance and is distributed by local officials on the basis of greatest need. In almost all cases, LIHEAP pays only part of the monthly energy bill of poor households. The $2.2 billion appropriated for 2005 - which constitutes the starting point for our calculations - is itself unusually low by historical standards; taking into account the price of home heating, the 2005 level of funding was the lowest since 1998.
The price of fuel (principally home natural gas, heating oil, and propane) has risen significantly over the last year. The disruption in energy supply caused by the Gulf Coast hurricanes will make the situation worse. On September 7 (after Hurricane Katrina but before Hurricane Rita), the Department of Energy issued new projections of monthly energy prices by energy source and by geographic region. If these projections prove accurate, the cost of heating the homes of LIHEAP beneficiaries will rise 47.5 percent between last winter and this winter (see Appendix 2 for a description of our calculation). This is the steepest one-year increase in these costs since 1974, before LIHEAP was created. Some analysts have recently suggested that prices may rise more than the Department of Energy projects, in which case even our estimated 47.5 percent increase may be conservative. Research indicates that, without funding increases to protect poor households from these price increases, many LIHEAP beneficiaries will reduce their food consumptions this winter to pay for the rise in heating costs. Because of the expected 47.5 percent increase in the cost of home heating (and more normal increases in the cost of weatherization and administration), simple arithmetic shows that LIHEAP funding for this winter, fiscal year 2006, needs to increase from last year's level of $2.182 billion by a minimum of $842 million, to a level of $3.025 billion.[1] (See Table 1)
However, this calculation assumes that the number of LIHEAP beneficiaries will not change between last winter and this winter. In fact, the number of LIHEAP beneficiaries has increased by an average of six percent per year from 2002 through 2005, in part because energy prices have risen by an average of 17 percent per year during the same period.[2] Given this history, a conservative assumption is that the number of LIHEAP beneficiaries will grow by at least another five percent this year. A five percent increase in beneficiaries will require another $151 million, bringing necessary total funding $3.176 billion.
A 47.5 Percent Funding Increase to Reflect Price Inflation Will Not Hold Beneficiaries Harmless Almost every household that receives LIHEAP assistance pays a share of its monthly heating bill out of its own income: LIHEAP pays part of the monthly bill, and the household pays the rest. If the price of heating rises and LIHEAP funding rises proportionally, the amount that the household must pay to avoid having its heat turned off would also rise proportionally. Thus, if the price of home heating is 47.5 percent higher this winter than last, a 47.5 percent increase in LIHEAP benefits would still require a 47.5 percent increase in out-of-pocket heating payments by poor LIHEAP beneficiaries. This phenomenon is explained more fully in the next section. The bottom line, though, is that to protect LIHEAP beneficiaries fully from the expected 47.5 percent increase in the cost of heating their homes - to ensure that their monthly out-of-pocket heating bill is not higher than it was last winter - Congress will need to provide LIHEAP funding of $4.961 billion, or $5.209 billion if caseload increases by five percent. The state-by-state distribution of LIHEAP funding for 2005 - and the approximate amount each state will need in 2006 to keep low-income LIHEAP beneficiaries from paying more out-of-pocket for their heat this winter - is displayed in Appendix 3. Why does a "hold harmless' policy require a greater increase? Below, we use a hypothetical example to explain why increasing funding for LIHEAP benefits by the same percentage that energy prices increase (i.e., increasing LIHEAP benefits for inflation as measured by home energy prices) does not shield poor LIHEAP beneficiaries from those price increases.[3] The graph below explains this phenomenon. The first bar - the left-most bar - shows a hypothetical bill for home heating for January 2005. The bill is $300, of which LIHEAP paid $100 and the household paid $200. Both last winter and the winter before, LIHEAP paid about one-third of the cost of home heating for its beneficiaries on average, so this distribution of costs is typical.[4] 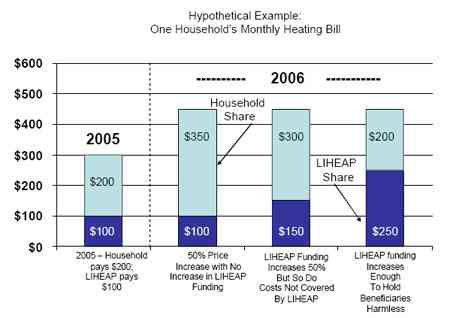 The second bar shows what happens if the price of energy rises 50 percent from January 2005 to January 2006. The total heating bill rises 50 percent, from $300 to $450. Now suppose that Congress freezes LIHEAP funding at 2005 levels. As the second bar shows, LIHEAP will continue to be able to cover only $100 of the January heating bill. Therefore, the amount owed by the household will necessarily rise by $150, from $200 to $350, an increase of 75 percent. The third bar shows what happens if, rather than freezing funding, Congress increases funding for LIHEAP benefits by 50 percent to match the 50 percent increase in home heating prices. As can be seen, the amount of the monthly heating bill covered by LIHEAP would grow from $100 to $150, an increase of 50 percent. But the remainder of the bill must still be covered by the household. And the remainder of the bill would grow from $200 to $300, also an increase of 50 percent. Together, LIHEAP and the household would cover the $450 bill. In this case, LIHEAP would continue to cover one-third of the heating bill and the beneficiary would continue to cover two-thirds. The key point is simple: even with a 50 percent increase in LIHEAP benefit funding, the household would suffer a 50 percent increase in its out-of-pocket costs for home heating. Yet the typical very poor household is unlikely to have significantly more income or resources this winter than it had last winter. The final bar illustrates what it would take to hold the household harmless for the increase in fuel prices. To do so means that the household would pay the same $200 for heat in January 2006 that it did in January 2005. To accomplish this result, LIHEAP would have to pay the remaining portion of the $450 bill, i.e., LIHEAP would have to pay $250 rather than the $100 it paid last year. In short, in this hypothetical example, LIHEAP funding would need to increase by 150 percent (that is, it would need to be 2½ times as large) in order to hold beneficiaries harmless for inflation in home heating prices. (See Appendix 1 for the math this example illustrates.) Conclusion Home heating prices are expected to rise by 47.5 percent this winter, and may rise by more. The LIHEAP caseload is likely to rise by at least five percent. These facts by themselves justify increasing LIHEAP funding from its 2005 level of $2.2 billion to almost $3.2 billion for 2006. (When the price of heating is accounted for, the 2005 level of LIHEAP funding is itself shown to be the lowest since 1998.) But such a funding increase will not protect individual LIHEAP households from harsh price increases. Even with such a funding increase, individual households will need to increase their own out-of-pocket heating payments by an average of 47.5 percent as well. Poor households could find such increased costs difficult or impossible to meet unless they fail to pay the rent, cut back substantially on food purchases, or fail to secure other necessities. The choice of whether to "heat or eat' is a real one for many poor households. A recent study by researchers from Stanford University, the University of Chicago, the RAND Corporation, and UCLA found that when poor families' heating bills go up during cold winter months, they reduce their spending on food by roughly the same amount as the increase in fuel expenditures.[5] Another recent study found that children in families that receive LIHEAP assistance are less likely to be underweight than children in families that are eligible for LIHEAP but do not receive it because of program funding limitations.[6] To protect those who rely on LIHEAP for heat in the dead of winter (or air conditioning during Southern summer heat waves), many of whom are elderly people living in poverty, would require a funding level of slightly more than $5.2 billion. (It should also be noted that even at a funding level of $5.2 billion, LIHEAP would be able to serve only about one-seventh of the roughly 35 million households that have incomes low enough to qualify for assistance. The millions of eligible households that will receive no LIHEAP assistance could face serious difficulties this winter.) The President requested only $2.0 billion for LIHEAP in his budget, and the congressional budget plan adopted in April incorporated the President's recommendations when setting its overall appropriations limit. These budget plans were designed at a time when energy prices were expected to be dramatically lower. Congress might best provide the necessary increase above the President's $2.0 billion request as an emergency supplemental appropriation. Such an emergency supplemental appropriation would be an appropriate component of legislation providing relief from Hurricanes Katrina and Rita. APPENDIX 1:
Calculating the amount needed to hold beneficiaries harmless for increases in the price of heating their homes In 2005, LIHEAP paid an estimated $1.746 billion or more in benefits to households in poverty to assist them with their heating (or cooling) bills. This appendix shows the math that explains how much Congress needs to increase that $1.746 billion if it intends to hold LIHEAP beneficiaries harmless from this projected 47.5 percent increase in home heating prices. As shown in the hypothetical example on pages 3 and 4, holding beneficiaries harmless cannot be accomplished simply by increasing $1.746 billion by 47.5 percent - substantially more is required. But how much more?
The math is straightforward. First, we need to calculate how much LIHEAP households paid out of pocket for heat in 2005 - which is also the amount they would pay out of pocket in 2006 if they were held harmless for the recent increase in energy prices. Then we need to calculate the total cost of heating LIHEAP households in 2006. That total cost, minus the amount that LIHEAP households should pay out of pocket in 2006, will equal the amount of LIHEAP benefits that are needed for 2006. We proceed in three steps:
Our conservative assumption that participation will rise five percent brings the required benefit level from $4.511 billion to $4.737 billion, the figure we show in Table 2. Combined with $472 million for weatherization and administrative costs (see the box on the previous page), the needed total reaches $5.209 billion. Holding beneficiaries almost harmless. Suppose that instead of holding beneficiaries fully harmless for the rising cost of fuel prices, Congress assumes the amount that LIHEAP beneficiaries should pay out of their own pockets should rise with general inflation, as measured by the Consumer Price Index. (This assumption would itself rest on the assumption that the disposable incomes of LIHEAP represents are fully keeping pace with inflation, which may not be the case due to erosion in real wages and increases in health care costs.) CBO expects the consumer price index to increase by 3.1 percent from the first quarter of 2005 to the first quarter of 2006. This approach would require only one new step. We make the initial calculations exactly as shown on the previous page, so that we estimate that LIHEAP households paid $4.074 billion in 2005 and we estimate that the total costs of heating LIHEAP households in 2006 will be $8.585 billion. We then add a new step. The amount that LIHEAP households are assumed to be able to pay from their own resources in 2006 is increased to $4.200 billion. This is the households' 2005 out-of-pocket payments increased by CPI inflation (or $4.074 billion times 103.1 percent). The last step remains the same as shown on the previous page.
Our conservative assumption that participation will rise five percent brings the required benefit funding level from $4.385 billion to $4.604 billion. Combined with $472 million for administrative costs and weatherization, the needed total reaches $5.076 billion. As can be seen, this figure is only slightly less than the $5.2 billion total needed to fully protect LIHEAP beneficiaries from rising heating prices. APPENDIX 2:
Calculating the price increase for heating homes This analysis uses price projections issued by the Department of Energy on September 7, 2005, to calculate the average increase in home heating costs that LIHEAP beneficiaries can expect to face this winter. The Energy Department issues month-by-month data that both go back historically and are projected into the future. The data are broken down by type of fuel and by region of the country. We used the following data: the retail price of natural gas in the east north central region and the west north central region (averaged); the retail price of home heating oil in the northeast; and the price of propane in the Midwest.[9] We then combined the prices of these three fuels in two steps. First, we averaged the price for each fuel separately over the months of December, January, and February 2005 and (as projected for) December, January, and February 2006.[10] We then weighted the winter prices of the three fuels in proportion to their use by LIHEAP households to produce a "market basket' of heating fuel for LIHEAP households. To do so, we combined data on which fuels are used by LIHEAP households, and how much of each fuel per household is used by LIHEAP households. The winter-to-winter increase in these market-basket prices constitutes a price index for LIHEAP fuel. It is this price index that shows a 47.5 percent increase from last winter to this winter.[11] There is some possibility that the next Department of Energy price projections will be even more unfavorable. APPENDIX 3:
LIHEAP funding by state The table below shows an approximation of the state-by-state implications of increasing funding to the $5.2 billion level needed to hold LIHEAP beneficiaries harmless for the increases in home heating prices that are projected for the coming winter, based on the Department of Energy's most recent price forecast. In this table, we assume that all of the $5.2 billion will be distributed. We also assume that funding will be distributed among states in the same proportions as it was in fiscal year 2005. In fact, the distribution of funding is likely to differ in fiscal 2006; under the law, the distribution of "regular' LIHEAP funds is based on a complex formula that includes low temperatures, changes in fuel prices, and poverty. Changes in fuel prices are most significant in changing the distribution of LIHEAP funds from 2005 to 2006. Specifically, natural gas prices are expected to rise even more than home heating oil or propane prices. Therefore, states that are even more reliant on natural gas than the typical state will suffer from price increases that are above the 47.5 percent average we calculate, while others will be subject to somewhat smaller price increases. As a result, the distribution of LIHEAP funds will (and should) change from 2005 to 2006. However, the data do not exist for us to redistribute LIHEAP funds relative to the 2005 distribution. This table should therefore be thought of as generally illustrative rather than precise. In addition, if any portion of the $5.2 billion is designated by Congress as "contingency' funding, that amount is released only to the extent the President feels it is needed, and to the extent it is distributed, the President has can choose where the funding goes. The table shows the distribution of LIHEAP funds in 2005 according to the Department of Health and Human Services, which administers LIHEAP at the federal level. Assuming that 2006 funding is distributed proportionally to 2005 funding, the table also shows the distribution of the $2.0 billion in funding President Bush requested for LIHEAP last February, the distribution of the additional $3.2 billion we calculate will be needed to hold LIHEAP households harmless for the spike in energy costs, and the distribution of the total suggested funding of $5.2 billion. As noted in the conclusion of our analysis on page 5, we assume that the requested $2.0 billion will be provided in the regular appropriation bills for 2006 and suggest the additional $3.2 billion be provided in the next supplemental appropriations bill related to Hurricanes Katrina and Rita, which are responsible to a significant degree for the spike in energy costs. End Notes: [1] The National Energy Assistance Directors' Administration (NEADA) estimates that up to 20 percent of the LIHEAP funds granted to states are used to help weatherize the homes of poor people and to cover administrative costs. This leaves 80 percent or more to be used as direct benefits that help to pay monthly fuel bills. In our calculations, we therefore assume that one-fifth of existing funding is used for weatherization and administrative costs and that this amount will grow with inflation as measured by the Consumer Price Index rather than with the much more rapid growth of fuel costs. Because the amount of LIHEAP funding actually used for benefits may exceed 80 percent - and therefore the amount of LIHEAP funding that needs to respond to the very rapid increase in fuel prices may exceed 80 percent - our assumption produces a conservative estimate of needed LIHEAP funding for 2006. [2] While some 35 million households are poor enough to be eligible for LIHEAP, only about 5 million households received LIHEAP assistance in 2005; rising prices could easily induce those who are poor and eligible to apply for the first time. Local officials try but are not required to accommodate all eligible households that apply. When funds are tight, local officials can reduce the average LIHEAP grant per household, turn away eligible applicants, or both. [3] This hypothetical example assumes that there is no increase in the number of households served by LIHEAP; as noted, participation has been growing by an average of six percent per year since 2002. [4] Calculated from data in the National Energy Assistance survey of LIHEAP recipients, NEADA, April 2005. [5] Jayanta Bhattacharya, Thomas DeLeire, Steven Haider, and Janet Currie, Heat or Eat? Cold-Weather Shocks and Nutrition in Poor American Families American Journal of Public Health, v. 93, no. 7, Jul. 2003, p. 1149-1154. [6] Children's Sentinel Nutrition Assessment Program, The Safety Net In Action, July 2004. [7] We can calculate the average share of beneficiary heating costs paid by LIHEAP from data supplied by the National Energy Assistance Directors' Association (NEADA), which consists of the state officials in charge of administering the LIHEAP program. [8] Some analysts may be interested in the equations associated with the calculations in this appendix. They are as follows. Let L be the amount of 2005 LIHEAP funding for benefits, or $1.746 billion in this case (administrative costs and weatherization are addressed separately). Let P be the percentage increase in heating prices, 47.5% in this case. Let S be the share of the winter heating bill paid by LIHEAP on average, 30.0% in this case. The three steps taken on the first page of the appendix are thus: First, T05 (total cost of heating in 2005) = L/S. And, H05 (household heating costs in 2005) = T05 - L. Second, T06 (total cost of heating in 2005) = T05 * (1+P). Finally, L06 (needed 2006 LIHEAP benefits) = T06 - H05. Substituting, we see that L06 = [T05*(1+P)] - [T05-L]. Substituting again, we see that L06 = [L/S*(1+P)] - [L/S - L]. Combining like terms, this equation becomes L06 = L * (P/S + 1). If, on the other hand, beneficiaries could afford to increase their out-of-pocket payments by the percentage growth of the CPI, which we denote by C, we take an additional step, as described above on this page. The additional step is that H06 (household heating costs in 2006) = H05 * (1+C). The new final step becomes L06 = T06 - H06. Substituting, we see that L06 = [T05*(1+P)] - [H05*(1+C)]. Substituting again, we see that L06 = [L/S*(1+P)] - [(T05-L)*(1+C)]. Substituting a final time, we see that L06 = [L/S*(1+P)] - [(L/S - L)*(1+C)]. Combining like terms, the equation becomes L06 = L * (P/S - C/S + C + 1). In fact, we assume that poor beneficiaries cannot afford to pay more for their fuel this year than last. This assumption is equivalent to setting C equal to zero. When C equals zero, the second equation is obviously identical to the first. [9] The prices of each fuel can differ from region to region. We used the prices in these particular regions because they represent the most typical areas and products used by LIHEAP beneficiaries. [10] The Monthly Energy Review, published by the Department of Energy, defines winter as those three months for purposes of its published "winter energy prices.' [11] Data showing the distribution of these three fuels among LIHEAP households is available for 2005 from a survey conducted by NEADA. However, while this survey tells us the percentage of LIHEAP households using natural gas, heating oil, or propane, the survey does not tell us how much of each fuel such a household typically uses. The latter data are available from the Residential Energy Consumption Survey of the Department of Energy. That survey was last conducted in 2001. We combined the two data sources to produce our market basket and our price index. The 2001 Department of Energy Survey also included comparable data on the share of LIHEAP households using each of the three fuels, which we could have used instead of the NEADA data. We prefer the NEADA data on the distribution of fuel use among LIHEAP households because it is more recent and therefore is less likely to be distorted by a substitution effect. Moreover, if we had used the Department of Energy data rather than the more current NEADA data, the price index would have shown a 54.2 percent increase from 2005 to 2006 rather than the 47.5 percent increase we used; employing a 54.2 percent estimate of heating fuel inflation would have increased our bottom-line LIHEAP funding figure from $5.2 billion to $5.6 billion.
Commentary: |
|||||||||||||||||||||||||||||||||||||||||||||||||||||||||||||||||||||||||||||||||||||||||||||||||||||||||||||||||||||||||||||||||||||||||||||||||||||||||||||||||||||||||||||||||||||||||||||||||||||||||||||||||||||||||||||||||||||||||||||||||||||||||||||||||||||||||||||||||||||||||||||||||||||||||||||||||||||||||||||||||||||||||||||||||||||||||||||||