Gallup
March 16, 2006
GALLUP NEWS SERVICE
PRINCETON, NJ -- With midterm congressional elections about eight months away, Americans hold a very dim view of the job Congress is doing. The low ratings are not unprecedented for an election year, but are among the worst Gallup has measured in more than a decade. In past midterm elections, there has been a greater net shift of seats from one party to the other when Congress' approval rating has been low. If there is not a significant change in the public's mood over the next several months, a low opinion of Congress coupled with an unpopular Republican president could make Republicans very vulnerable in the fall.
A recent Gallup Poll, conducted March 13-16, 2006, finds just 27% of Americans approving (and 65% disapproving) of the way Congress is handling its job. Congress' approval rating has been below 30% since October 2005, and the current rating marks the continuation of a slow descent from record-high congressional approval after the Sept. 11 terror attacks.
a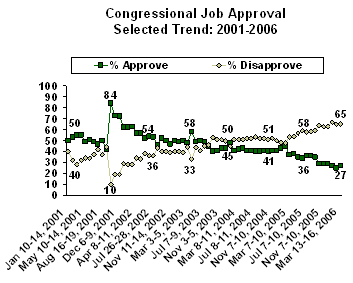
In fact, the recent ratings of Congress are the worst Gallup has measured in more than a decade. An Oct. 22-25, 1994, Gallup Poll shows 23% of Americans approving of Congress just before a Republican landslide in that year's elections. The lowest approval ratings Gallup has recorded for Congress were 18% in March 1992 and 19% in June 1979.
Not surprisingly, Republicans (45%) are much more likely to approve of the Republican-controlled Congress at this point than are independents (20%) and Democrats (17%), but even half of Republicans disapprove.
Congressional Approval and the Election
The low congressional job ratings stand in stark contrast to the last midterm election year. In October 2002, 50% of Americans approved of Congress, and approval had been as high as 63% earlier that year. In that election, the incumbent Republican Party gained seats in the U.S. House of Representatives, an unusual occurrence in a midterm election year.
Ratings of Congress generally track other "mood of the nation" indicators, such as Americans' assessments of how things are going in the United States in general, perceptions of the economy, and presidential job approval. None of these are currently rated positively. Research has demonstrated a strong link between these factors and midterm election outcomes, particularly presidential approval and measures of economic health. Generally speaking, the worse the ratings on these measures, the worse the incumbent party fares in the elections.
|
National Mood Indicators |
|
|
2006 Mar 13-16 |
|
|
Question items |
Percent positive rating (dimension) |
|
% |
|
|
Congressional approval |
27 (approval) |
|
George W. Bush approval |
37 (approval) |
|
Direction of the nation |
29 ("satisfied") |
|
Current state of the economy |
34 ("excellent" or "good") |
|
Direction of the economy |
29 ("getting better") |
During recent midterm election years, low congressional approval ratings have been associated with greater shifts in the partisan composition of the U.S. House of Representatives. In the five elections since 1974 in which Congress' approval rating was below 40%, the average net change in U.S. House seats from one party to the other was 29. In the three midterm elections in which congressional approval ratings were above 40%, the average change was five seats.
|
Congressional Approval Rating and Partisan Shifts of
U.S. House Seats |
||
|
Year |
Congress approval |
Net seat change from |
|
% |
|
|
|
2002 |
50 |
6 |
|
1998 |
44 |
5 |
|
1994 |
23 |
53 |
|
1990 |
24 |
8 |
|
1986 |
42 |
5 |
|
1982 |
29 |
28 |
|
1978 |
29 |
11 |
|
1974 |
35 |
43 |
The direction of the net change is tied more closely to the party controlling the White House than the party controlling Congress. In the last eight midterm elections, the president's party suffered a net loss of U.S. House seats six times, while the party in control of Congress had a net loss of seats three times. During two of the elections, 1978 and 1994, the same party controlled Congress and the White House.
|
Year |
Party Controlling House |
Party of the President |
Congress approval |
Presidential approval |
Seat gain/loss, president's party |
|
|
|
% |
% |
|
|
|
2002 |
Rep. |
Rep. |
50 |
63 |
+6 |
|
1998 |
Rep. |
Dem. |
44 |
66 |
+5 |
|
1994 |
Dem. |
Dem. |
23 |
46 |
-53 |
|
1990 |
Dem. |
Rep. |
24 |
54 |
-8 |
|
1986 |
Dem. |
Rep. |
42 |
63 |
-5 |
|
1982 |
Dem. |
Rep. |
29 |
42 |
-28 |
|
1978 |
Dem. |
Dem. |
29 |
49 |
-11 |
|
1974 |
Dem. |
Rep. |
35 |
54 |
-43 |
The fact that both congressional and presidential approval ratings are low does not bode well for the Republican Party. The current situation is similar to the political environment in 1978 and 1994, when Democrats controlled both the legislative and executive branches -- which were both unpopular. Those elections resulted in net losses for the Democratic Party of 11 and 53 seats, respectively.
Such a dramatic change may not be as likely this year, as recent redrawing of U.S. House districts has resulted in an increasing proportion of safe seats for both parties. But if the political environment does not improve for the Republicans between now and November, Republican members of Congress will find out whether their districts are safe enough to insulate them from a possibly strong Democratic tide.
Survey Methods
These results are based on telephone interviews with a randomly selected national sample of 1,000 adults, aged 18 and older, conducted March 13-16, 2006. For results based on this sample, one can say with 95% confidence that the maximum error attributable to sampling and other random effects is ±3 percentage points. In addition to sampling error, question wording and practical difficulties in conducting surveys can introduce error or bias into the findings of public opinion polls.
Do you approve or disapprove of the way Congress is handling its job?
|
Approve |
Disapprove |
No opinion |
|
|
% |
% |
% |
|
|
2006 |
|
|
|
|
2006 Mar 13-16 |
27 |
65 |
8 |
|
2006 Feb 6-9 |
25 |
65 |
10 |
|
2006 Jan 9-12 |
27 |
67 |
7 |
|
2005 |
|
|
|
|
2005 Dec 5-8 |
29 |
63 |
8 |
|
2005 Nov 7-10 |
29 |
63 |
8 |
|
2005 Oct 13-16 |
29 |
64 |
7 |
|
2005 Sep 12-15 |
35 |
59 |
6 |
|
2005 Aug 8-11 |
36 |
58 |
6 |
|
2005 Jul 7-10 |
36 |
58 |
6 |
|
2005 Jun 6-8 |
34 |
59 |
7 |
|
2005 May 2-5 |
35 |
57 |
8 |
|
2005 Apr 4-7 |
38 |
54 |
8 |
|
2005 Mar 7-10 |
37 |
53 |
10 |
|
2005 Feb 7-10 |
45 |
48 |
7 |
|
2005 Jan 3-5 |
43 |
48 |
9 |
|
2004 |
|
|
|
|
2004 Dec 5-8 |
41 |
50 |
9 |
|
2004 Nov 7-10 |
41 |
52 |
7 |
|
2004 Oct 11-14 |
40 |
51 |
9 |
|
2004 Sep 13-15 |
41 |
52 |
7 |
|
2004 Aug 9-11 |
40 |
52 |
8 |
|
2004 Jul 8-11 |
40 |
53 |
7 |
|
2004 Jun 3-6 |
41 |
52 |
7 |
|
2004 May 2-4 |
41 |
52 |
7 |
|
2004 Apr 5-8 |
43 |
51 |
6 |
|
2004 Mar 8-11 |
42 |
51 |
7 |
|
2004 Feb 9-12 |
41 |
51 |
8 |
|
2004 Jan 12-15 |
48 |
45 |
7 |
|
2003 |
|
|
|
|
2003 Dec 11-14 |
43 |
50 |
7 |
|
2003 Nov 3-5 |
43 |
51 |
6 |
|
2003 Oct 6-8 |
41 |
51 |
8 |
|
2003 Sep 8-10 |
40 |
53 |
7 |
|
2003 Aug 4-6 |
45 |
46 |
9 |
|
2003 Jul 7-9 |
49 |
45 |
6 |
|
2003 Jun 12-15 |
50 |
41 |
9 |
|
2003 May 5-7 |
49 |
44 |
7 |
|
2003 Apr 7-9 |
58 |
33 |
9 |
|
2003 Mar 3-5 |
48 |
44 |
8 |
|
2003 Feb 3-6 |
50 |
39 |
11 |
|
2003 Jan 13-16 |
49 |
40 |
11 |
|
2002 |
|
|
|
|
2002 Dec 5-8 |
50 |
40 |
10 |
|
2002 Nov 11-14 |
47 |
39 |
14 |
|
2002 Oct 3-6 |
50 |
40 |
10 |
|
2002 Sep 5-8 |
52 |
40 |
8 |
|
2002 Aug 5-8 |
46 |
43 |
11 |
|
2002 Jul 26-28 |
53 |
36 |
11 |
|
2002 Jul 9-11 |
54 |
36 |
10 |
|
2002 Jun 3-6 |
52 |
38 |
10 |
|
2002 May 6-9 |
57 |
33 |
10 |
|
2002 Apr 8-11 |
57 |
34 |
9 |
|
2002 Mar 4-7 |
63 |
28 |
9 |
|
2002 Feb 4-6 |
62 |
28 |
10 |
|
2002 Jan 7-9 |
62 |
29 |
9 |
|
2001 |
|
|
|
|
2001 Dec 6-9 |
72 |
19 |
9 |
|
2001 Nov 8-11 |
73 |
19 |
8 |
|
2001 Oct 11-14 |
84 |
10 |
6 |
|
2001 Sep 7-10 |
42 |
44 |
14 |
|
2001 Aug 16-19 |
50 |
37 |
13 |
|
2001 Aug 3-5 |
47 |
42 |
11 |
|
2001 Jul 19-22 |
49 |
37 |
14 |
|
2001 Jun 11-17 |
51 |
34 |
15 |
|
2001 May 10-14 |
49 |
34 |
17 |
|
2001 Apr 6-8 |
55 |
32 |
13 |
|
2001 Mar 5-7 |
55 |
28 |
17 |
|
2001 Feb 1-4 |
53 |
32 |
15 |
|
2001 Jan 10-14 |
50 |
40 |
10 |
|
2000 |
|
|
|
|
2000 Dec 2-4 |
56 |
34 |
10 |
|
2000 Oct 6-9 |
49 |
42 |
9 |
|
2000 Aug 29-Sep 5 |
48 |
42 |
10 |
|
2000 May 18-21 |
39 |
52 |
9 |
|
2000 Jan 7-10 |
51 |
42 |
7 |
|
1999 |
|
|
|
|
1999 Sep 23-26 |
37 |
56 |
7 |
|
1999 Jul 13-14 |
39 |
51 |
10 |
|
1999 Jun 11-13 |
41 |
53 |
6 |
|
1999 Apr 13-14 |
45 |
47 |
8 |
|
1999 Feb 12-13 |
41 |
54 |
5 |
|
1999 Jan 15-17 |
50 |
46 |
4 |
|
1998 |
|
|
|
|
1998 Dec 15-16 |
42 |
52 |
6 |
|
1998 Nov 13-15 |
41 |
54 |
5 |
|
1998 Oct 29-Nov 1 |
44 |
47 |
9 |
|
1998 Oct 9-12 |
47 |
46 |
7 |
|
1998 Oct 6-7 |
44 |
48 |
8 |
|
1998 Sep 11-12 |
55 |
36 |
9 |
|
1998 May 8-10 |
44 |
48 |
8 |
|
1998 Apr 17-19 |
49 |
40 |
11 |
|
1998 Feb 13-15 |
57 |
33 |
10 |
|
1998 Jan 30-Feb 1 |
56 |
35 |
9 |
|
1998 Jan 16-18 |
42 |
47 |
11 |
|
1997 |
|
|
|
|
1997 Dec 18-21 |
39 |
52 |
9 |
|
1997 Oct 27-29 |
36 |
53 |
11 |
|
1997 Aug 22-25 |
41 |
48 |
11 |
|
1997 Jul 25-27 |
34 |
57 |
9 |
|
1997 May 6-7 |
32 |
58 |
10 |
|
1997 Apr 18-20 |
30 |
59 |
11 |
|
1997 Feb 24-26 |
37 |
48 |
15 |
|
1997 Jan 31-Feb 2 |
36 |
51 |
13 |
|
1996 |
|
|
|
|
1997 Jan 10-13 |
41 |
49 |
10 |
|
1996 Oct 26-29 |
34 |
51 |
15 |
|
1996 Aug 5-7 |
39 |
49 |
12 |
|
1996 May 9-12 |
30 |
65 |
5 |
|
1996 Apr 9-10 |
35 |
57 |
8 |
|
1995 |
|
|
|
|
1995 Sep 22-24 |
30 |
61 |
9 |
|
1995 Aug 28-30 |
30 |
60 |
10 |
|
1995 Jul 7-9 |
35 |
55 |
10 |
|
1995 May 11-14 |
34 |
57 |
9 |
|
1995 Apr 17-19 |
37 |
54 |
9 |
|
1995 Mar 27-29 |
31 |
61 |
8 |
|
1995 Mar 17-19 |
32 |
59 |
9 |
|
1995 Feb 24-26 |
35 |
53 |
12 |
|
1995 Feb 3-5 |
38 |
53 |
9 |
|
1995 Jan 16-18 |
33 |
52 |
15 |
|
1994 |
|
|
|
|
1994 Dec 28-30 |
23 |
66 |
11 |
|
1994 Oct 22-25 |
23 |
70 |
7 |
|
1994 Oct 7-9 |
21 |
73 |
6 |
|
1994 Jul 15-17 |
27 |
65 |
8 |
|
1994 Mar 25-27 |
29 |
63 |
8 |
|
1994 Feb 26-28 |
28 |
66 |
6 |
|
1993 |
|
|
|
|
1993 Nov 2-4 |
24 |
69 |
8 |
|
1993 Aug 8-10 |
23 |
69 |
8 |
|
1993 Jul 19-21 |
24 |
65 |
11 |
|
1993 Feb 26-28 |
27 |
54 |
19 |
|
1992 |
|
|
|
|
1992 Mar 3 ^ |
18 |
78 |
3 |
|
1991 |
|
|
|
|
1991 Oct 10-13 |
40 |
54 |
6 |
|
1991 Jul 25-28 |
32 |
53 |
15 |
|
1990 |
|
|
|
|
1990 Nov 2-4 |
26 |
63 |
11 |
|
1990 Oct 25-28 |
24 |
68 |
8 |
|
1990 Oct 18-21 |
23 |
64 |
13 |
|
1990 Oct 11-14 |
28 |
65 |
7 |
|
1988 |
|
|
|
|
1988 Sep 9-11 |
42 |
42 |
16 |
|
1987 |
|
|
|
|
1987 Aug 24-Sep 2 |
42 |
49 |
9 |
|
1986 |
|
|
|
|
1986 Apr 11-14 |
42 |
37 |
21 |
|
1983 |
|
|
|
|
1983 Apr 29-May 2 |
33 |
43 |
24 |
|
1982 |
|
|
|
|
1982 Jun 11-14 |
29 |
54 |
17 |
|
1981 |
|
|
|
|
1981 Jun 19-22 |
38 |
40 |
22 |
|
1980 |
|
|
|
|
1980 Jun 13-16 |
25 |
56 |
19 |
|
1979 |
|
|
|
|
1979 Jun 1-4 |
19 |
61 |
20 |
|
1978 |
|
|
|
|
1978 Sep 8-11 |
29 |
49 |
22 |
|
1977 |
|
|
|
|
1977 Sep 9-12 |
35 |
44 |
21 |
|
1977 Aug 5-8 |
36 |
44 |
20 |
|
1977 Jun 3-6 |
34 |
42 |
24 |
|
1977 May 20-23 |
40 |
40 |
20 |
|
1977 Mar 25-28 |
36 |
42 |
22 |
|
1976 |
|
|
|
|
1976 Jan 23-26 |
24 |
58 |
18 |
|
1975 |
|
|
|
|
1975 Oct 31-Nov 3 |
28 |
54 |
18 |
|
1975 Jun 27-30 |
29 |
54 |
17 |
|
1975 Apr 18-21 |
38 |
48 |
14 |
|
1975 Feb 28-Mar 3 |
32 |
50 |
18 |
|
1974 |
|
|
|
|
1974 Oct 11-14 |
35 |
43 |
22 |
|
1974 Aug 16-19 |
30 |
47 |
23 |
|
1974 Apr 12-15 |
30 |
47 |
23 |
Commentary: